

Highlights
An overview of violent and property crime in Memphis and additional high-crime cities.
Crime in America.Net-Chat GPT’s “Top 10 Sources for Crime in America” based on primary statistical sources with trusted secondary analysis.
Author
Leonard Adam Sipes, Jr.
Former Senior Specialist for Crime Prevention and Statistics for the Department of Justice’s clearinghouse. Former Director of Information Services, National Crime Prevention Council. Former Adjunct Associate Professor of Criminology and Public Affairs-University of Maryland, University College. Former police officer. Retired federal senior spokesperson.
Former advisor to presidential and gubernatorial campaigns. Former advisor to the “McGruff-Take a Bite Out of Crime” national media campaign. Produced successful state anti-crime media campaigns.
Thirty-five years of directing award-winning (50+) public relations for national and state criminal justice agencies. Interviewed thousands of times by every national news outlet, often with a focus on crime statistics and research. Created the first state and federal podcasting series. Produced a unique and emulated style of government proactive public relations.
Certificate of Advanced Study-The Johns Hopkins University.
Author of ”Success With The Media: Everything You Need To Survive Reporters and Your Organization,” available at Amazon and additional bookstores.
Crime in America.Net-“Trusted Crime Data, Made Clear.”
Quoted by The Associated Press, USA Today, A&E Television, the nationally syndicated Armstrong Williams Television Show (30 times), Department of Justice documents, US Supreme Court briefs, C-SPAN, the National Institute of Health, college and university online libraries, multiple books and journal articles, The Huffington Post, JAMA, The National Institute of Corrections, The Office of Juvenile Justice And Delinquency Prevention, The Bureau of Justice Assistance, Gartner Consulting, The Maryland Crime Victims Resource Center, The Marshall Project, The Heritage Foundation via Congressional testimony, Law Enforcement Today, Law Officer.Com, Blue Magazine, Corections.Com, Prison Legal News, The Hill (newspaper of Congress), the Journal of Offender Monitoring, Inside Edition Television, Yomiuri Shimbun (Asia’s largest newspaper), LeFigaro (France’s oldest newspaper), Oxygen and allied publications, Forbes, Newsweek, The Economist, The Toronto Sun, Homeland Security Digital Library, The ABA Journal, The Daily Express (UK) The Harvard Political Review, The Millennial Source, The Federalist Society, Lifewire, The Beccaria Portal On Crime (Europe), The European Journal of Criminology, American Focus and many additional publications.
Sign up for notice of new articles on the front page of this site.
A comprehensive overview of crime for recent years is available at Violent and Property Crime Rates In The U.S.
Article
President Trump announced that the next city targeted for National Guard Troops and additional federal agents is Memphis, TN.
I have a reader’s inquiry about crime statistics for Memphis and other cities ranked in the top ten. The latest data for those cities is below
Associated Press-Memphis
NASHVILLE, Tenn. (Associated Press) — President Donald Trump said Friday he’ll send the National Guard to address crime concerns in Memphis with support from the mayor and Tennessee’s governor, making it his latest expansion of military forces into American cities that has tested the limits of presidential power and drawn sharp criticism from local leaders.
Speaking on Fox News, Trump said “the mayor is happy” and “the governor is happy” about the pending deployment. The city is “deeply troubled,” he said, adding, “we’re going to fix that just like we did Washington,” where he’s sent the National Guard and surged federal law enforcement.
Trump has also suggested he could send troops to New Orleans, another Democratic-run city in a Republican-leaning state.
The president’s announcement came just days after Memphis police reported decreases across all major crime categories in the first eight months of 2025 compared to the same period in previous years. Overall crime hit a 25-year low, while murder hit a six-year low, police said.
Asked Friday if city and state officials had requested a National Guard deployment — or had formally signed off on it — the White House didn’t answer. It also didn’t offer a possible timeline or say whether federal law enforcement would be surged in connection with a guard deployment to Memphis, as happened when troops were deployed to Washington.
Trump said Friday that he “would have preferred going to Chicago,” where local politicians have fiercely resisted his plans, but suggested the city was too “hostile” with “professional agitators.”
Reuters
Reuters, President Trump will send 1,000 Louisiana National Guard troops to conduct law enforcement operations in the state’s urban centers.
Top Ten Cities For Violent Crime
To answer the reader’s question, I relied on ChatGPT to compile the top ten city crime lists for 2024 (the latest full report from the FBI) and 2023, using rates based on crimes reported to law enforcement as compiled by the FBI. These numbers are consistent with the FBI Table 8 / CIUS (Crime in the US) 2024 city-level data.
Warning
There are multiple lists of the most dangerous or violent cities in the US. The list below may be different from those offered by media, commercial, or advocacy sources, depending on the criteria used.
Sites are creating their own lists of the most dangerous cities, and they can rely on an endless list of variables, including income, poverty rates, economic data, size of city, specific crime chosen, surveys, numbers from other federal agencies like the CDC, or rates or numbers from the FBI. See “Most Dangerous Cities.”
The Overwhelming Number Of Crimes Are Not Reported To Law Enforcement
Readers need to understand that the overwhelming majority of what we call crime is not reported to law enforcement agencies; only 38 percent of urban violent crimes (what follows) are reported. See below.
Then there’s the National Crime Victimization Survey, which recorded record highs for rates of violence for the last two reporting periods. See below.
Thus, whenever you see lists of crime for cities and states, understand that they comprise data that’s vastly undercounted. For commercial, media, or advocacy sites, they may use a variety of criteria not listed below for 2024 statistics.
What’s Below For 2024 and 2023
What’s below for 2024 is FBI data based on rates of reported crimes. 2023 data includes the use of CDC (Centers for Disease Control) data for homicides.
Top 10 U.S. Cities by Homicide Rate (2024) From ChatGPT-Crimes Reported To Law Enforcement Via The FBI
-
Jackson, MS — ~ 77.0
-
Birmingham, AL — ~ 59.0
-
St. Louis, MO — ~ 54.4
-
Memphis, TN — ~ 52.0
-
Baltimore, MD — ~ 34.8
-
New Orleans, LA — ~ 34.7
-
Detroit, MI — ~ 32.1
-
Cleveland, OH — ~ 31.
-
Richmond, VA – 23.0
-
Indianapolis, IN – 23.8
Top 10 U.S. Cities by Violent Crime Rate (2024) From ChatGPT-Crimes Reported To Law Enforcement Via The FBI
-
Memphis, TN — ~ 2,300
-
St. Louis, MO — ~ 1,950
-
Baltimore, MD — ~ 1,850
-
Detroit, MI — ~ 1,800
-
New Orleans, LA — ~ 1,750
-
Cleveland, OH — ~ 1,700
-
Birmingham, AL — ~ 1,650
-
Oakland, CA — ~ 1,550
-
Kansas City, MO — ~ 1,500
-
Indianapolis, IN — ~ 1,450
Top 10 U.S. Cities by Overall Reported Crime Rate (2024) (Violent + Property Crime) From ChatGPT-Crimes Reported To Law Enforcement Via The FBI
-
Memphis, TN — ~ 6,800
-
St. Louis, MO — ~ 6,400
-
Detroit, MI — ~ 6,300
-
Baltimore, MD — ~ 6,100
-
New Orleans, LA — ~ 6,000
-
Cleveland, OH — ~ 5,900
-
Milwaukee, WI — ~ 5,800
-
Oakland, CA — ~ 5,600
-
Albuquerque, NM — ~ 5,500
-
San Francisco, CA — ~ 5,400
Crime Statistics For The Top 10 U.S. Cities by Homicide Rate (per 100,000 residents) Per ChatGPT (2023)- Crimes Reported To Law Enforcement Via The FBI
(Most recent compiled year: 2023–2024, FBI + CDC based; city-proper)
- New Orleans, LA – ~70 per 100k (2023)
- Memphis, TN – ~60 per 100k (2023)
- St. Louis, MO – ~59 per 100k (2023)
- Baltimore, MD – ~56 per 100k (2023)
- Detroit, MI – ~47 per 100k (2023)
- Birmingham, AL – ~45 per 100k (2023)
- Jackson, MS – ~44 per 100k (2023)
- Cleveland, OH – ~42 per 100k (2023)
- Washington, D.C. – ~41 per 100k (2023)
- Richmond, VA – ~39 per 100k (2023)
Top 10 U.S. Cities by Violent-Crime Rate (per 100,000 residents) Per ChatGPT (2023)-Crimes Reported To Law Enforcement Via The FBI
(Includes homicide, rape, robbery, aggravated assault; FBI CIUS 2023–2024 tabulations)
- Memphis, TN – ~2,300 per 100k (2023)
- St. Louis, MO – ~1,950 per 100k (2023)
- Baltimore, MD – ~1,900 per 100k (2023)
- Detroit, MI – ~1,850 per 100k (2023)
- New Orleans, LA – ~1,750 per 100k (2023)
- Cleveland, OH – ~1,700 per 100k (2023)
- Birmingham, AL – ~1,650 per 100k (2023)
- Oakland, CA – ~1,600 per 100k (2023)
- Kansas City, MO – ~1,550 per 100k (2023)
- Indianapolis, IN – ~1,500 per 100k (2023)
Top 10 U.S. Cities by Overall Reported Crime Rate (violent + property) Per Chat GPT (2023-Crimes Reported To Law Enforcement Via The FBI
(FBI Uniform Crime Reports; some high rates are property-crime driven — especially theft and auto theft)
- Memphis, TN – ~6,800 per 100k (2023)
- St. Louis, MO – ~6,500 per 100k (2023)
- Detroit, MI – ~6,400 per 100k (2023)
- Baltimore, MD – ~6,200 per 100k (2023)
- New Orleans, LA – ~6,100 per 100k (2023)
- Cleveland, OH – ~6,000 per 100k (2023)
- Milwaukee, WI – ~5,800 per 100k (2023)
- Oakland, CA – ~5,700 per 100k (2023)
- Albuquerque, NM – ~5,600 per 100k (2023)
- San Francisco, CA – ~5,500 per 100k (2023)
Bureau of Justice Statistics Description of Reported Crimes
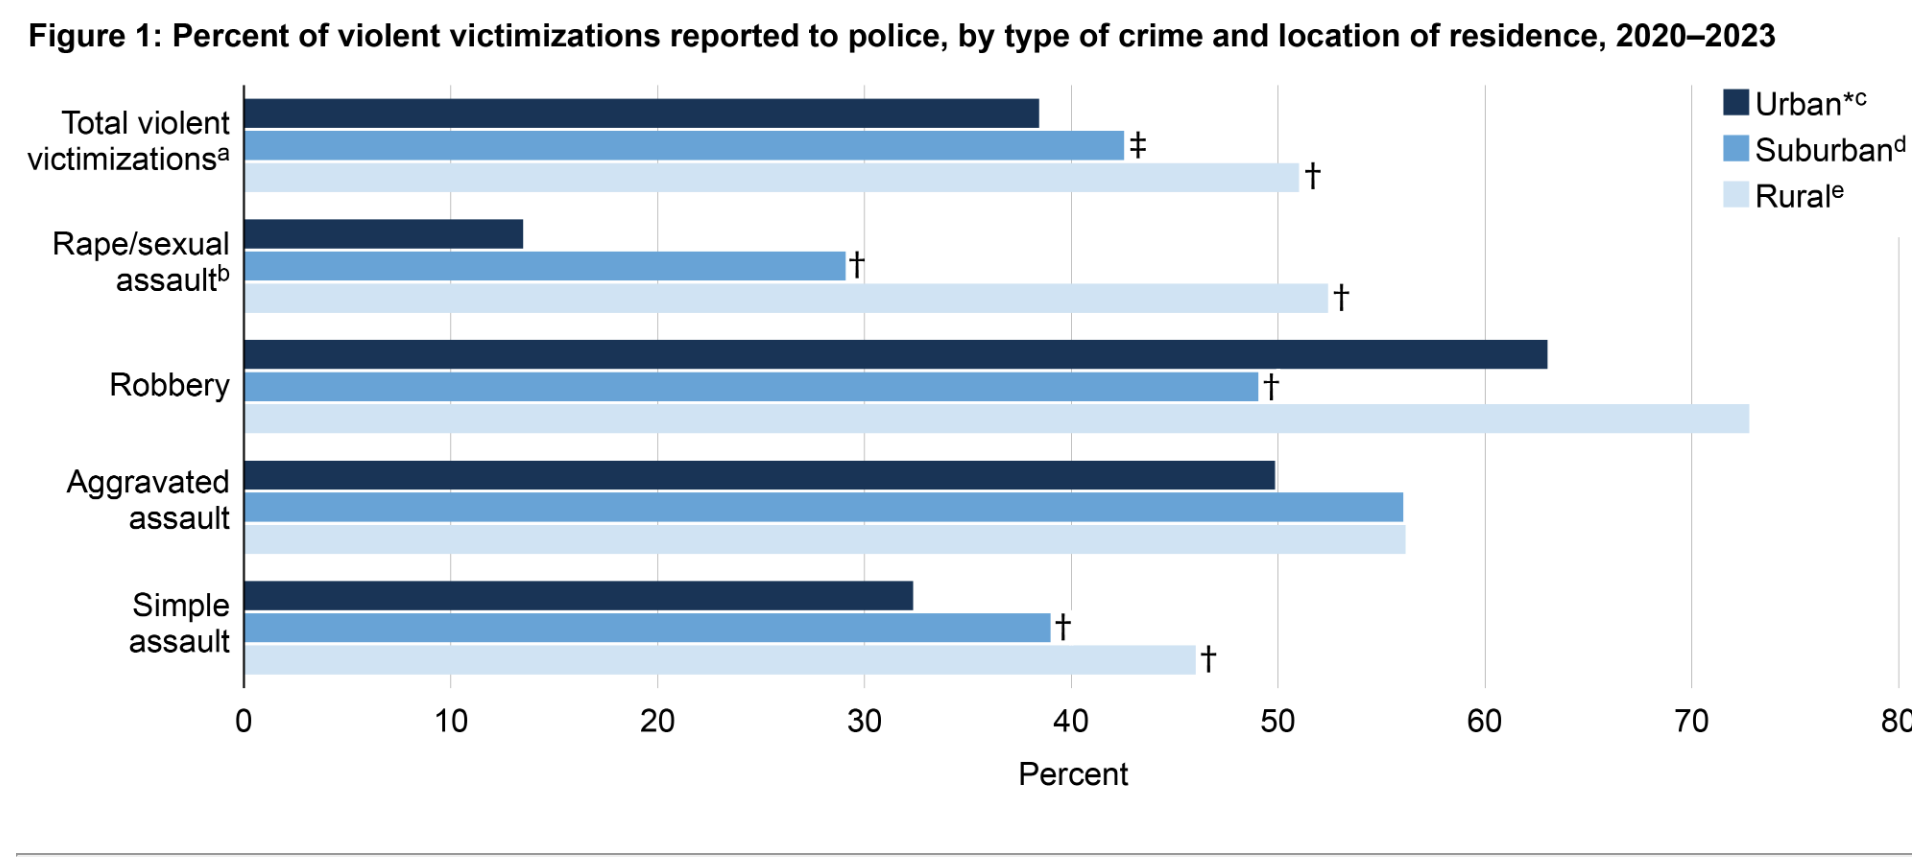
A new USDOJ report presents findings on the percentage of victimizations reported to police by type of crime and location of residence for the aggregate period of 2020 through 2023. It details the percentage of both violent and property victimizations reported to police by type of crime and location of the victim’s residence. The data used to produce this report are from the National Crime Victimization Survey (NCVS). In the NCVS, victims’ residences can be classified as urban, suburban, or rural.
Highlights
The overwhelming majority of crimes are not reported to law enforcement and the FBI.
About 38% of violent victimizations in urban areas were reported to police, which was lower than the percentages in suburban (43%) and rural (51%) areas.
The percentage of rape and sexual assault victimizations in rural areas that were reported to police (52%) was almost four times higher than the share reported to police in urban areas (13%), and almost two times higher than the share reported in suburban areas (29%).
Reporting to police for simple assault victimizations was higher in suburban (39%) and rural areas (46%) than urban areas (32%).
Simple assaults likely comprised roughly 55–60 percent of total violent victimizations per ChatGPT.
For robbery, the percentage of victimizations reported to police was lower in suburban areas (49%) than urban areas (63%). The percentage of robbery victimizations reported to police was not statistically different between urban and rural areas.
Patterns in police reporting for property crime during 2020–2023 were similar to those for violent crime. A quarter (25%) of all property victimizations in urban areas were reported to police, which was lower than the percentages in suburban (33%) and rural (36%) areas.
Approximately 80 percent of what we call crime are property events. If 25 percent of property crimes are reported to the police in urban areas, then the overwhelming percentage of crime is not recorded in cities.
Chart
National Crime Victimization Survey
The National Crime Victimization Survey in a 2023 report for the calendar year 2022, offered a continuing increase in violent crime in the nation’s history (44 percent), according to analyst Jeff Asher, and The Marshall Project. BJS’s 2023 NCVS shows rates similar to 2022, Bureau of Justice Statistics.
It remains the largest increase in violent crime in the nation’s history. The 2024 yearly NCVS report will be offered soon.
Conclusions
Please remember that every index you use to judge crime rates may give you different answers depending on the criteria they use. The base of most reports, however, is reported crimes as compiled by the FBI.
The cities mentioned above are well known to those of us studying crime.
Per this list, Memphis has the highest rate of violent crime for 2024 (the latest full year report), the highest rate for the combination of violent and property crimes in 2024, the highest rate for violence in 2023, and the highest rates of violent and property crime in 2023.
Memphis has a serious crime problem.
Yes, crimes reported to law enforcement have declined in Memphis and cities throughout the country, probably a regression to the mean or average. The Major Cities Chiefs Association recorded a 50 percent increase in homicides and a 36 percent increase in aggravated assaults for 2019-2023, so crime in cities was bound to go down regardless of interventions.
Fear of crime is at a near record high, per Gallup and other sources, while noting that the National Crime Victimization Survey is currently at record highs; the updated survey for 2024 will be out soon.
Overall, crime hit a 25-year low, while murder hit a six-year low in Memphis, but I’m guessing that the reduction is somewhat meaningless to its citizens. A dangerous city with crime reductions remains a dangerous city, which partially explains the high national fear of crime.
Use of ChatGPT
ChatGPT fact-checked the article. ChatGPT was used to research crime rates.
Privacy Policy
We do not collect your personal information. See our privacy policy at “About This Site.”
See More
See more articles on crime and justice at Crime in America.
Most Dangerous Cities/States/Countries at Most Dangerous Cities.
US Crime Rates at Nationwide Crime Rates.
National Offender Recidivism Rates at Offender Recidivism.
The Crime in America.Net RSS feed (https://crimeinamerica.net/?feed=rss2) provides subscribers with a means to stay informed about the latest news, publications, and other announcements from the site.