

Highlights-New Reports On The Future On Local Crime, Fear And Police Perceptions
What’s being explored by the Bureau of Justice Statistics of the US Department of Justice could have a major impact on your local crime numbers.
It could establish a list of the most dangerous and fearful cities plus opinions of police agencies.
The Local-Area Crime Survey is one of several initiatives the Bureau of Justice Statistics has undertaken to increase the availability of victimization data to local jurisdictions.
Highlights of The Report
The cities that score the worst in a variety of crime measurements were Baltimore, Detroit, Cleveland, St. Loius, Atlanta and Providence with Orlando, Sacramento, Las Vegas, Washington, D.C. and Miami registering high for some categories.
Most residents gave law enforcement high marks for satisfaction (generally speaking, 70 percent or more) with Providence, Detroit, Baltimore and Miami having the lowest scores.
Editor’s Notes
I asked the Bureau of Justice Statics the questions below on May 4 and 5:
1 Does the Bureau of Justice Statistics plan on releasing local crime, fear and police performance data? If so, when?
2 It seems that the Bureau of Justice Statistics foresees a future where local crime data based on the National Crime Victimization Survey and fear of crime plus police performance numbers will be offered to the public, correct?
There was no response by press time (May 10).
There are a variety of research products from contractors addressing this issue, see Bureau Of Justice Statistics. My assumption is that the Bureau of Justice Statistics is still in an exploratory stage.
Author
Leonard Adam Sipes, Jr.
Retired federal senior spokesperson. Thirty-five years of directing award-winning public relations for national and state criminal justice agencies. Interviewed multiple times by every national news outlet. Former Senior Specialist for Crime Prevention for the Department of Justice’s clearinghouse. Former Director of Information Services, National Crime Prevention Council. Former Adjunct Associate Professor of criminology and public affairs-University of Maryland, University College. Former advisor to presidential and gubernatorial campaigns. Former advisor to the “McGruff-Take a Bite Out of Crime” national media campaign. Certificate of Advanced Study-Johns Hopkins University. Former police officer. Aspiring drummer.
Article
Most Dangerous Cities is a popular article on Crime in America. Everyone wants to know if their city or state or zip code has crime issues, see US Crime Rates.
All of the reports in Most Dangerous Cities are based on crimes reported to law enforcement and offered nationally through the FBI.
This presents challenges because the vast majority of crime is not reported. For example, per the Bureau of Justice Statistics, only 41 percent of violent crimes are reported to law enforcement. The percentage is much lower for property crime.
If numbers are offered via crime surveys, local reports will document much higher levels of crime.
Local Crime And Fear Statistics And Data on Police Perceptions
There is a remedy for the reporting of all crime (not just reported crime) through the National Crime Victimization Survey from The Bureau of Justice Statistics of the US Department of Justice using surveys based on the US Census.
It asks people about their victimization experiences. This is a collection of all crime (at least for those crimes measured) not just reported crime.
The problem with the National Crime Victimization Survey is that there isn’t a current method to analyze and present crime for cities and states (like the FBI does).
It’s obvious to me that the data below is an attempt to correct this disadvantage.
You can read previous Department of Justice reports measuring local crime at Most Dangerous Cities. See the bottom of the article for data from the Bureau of Justice Statistics presenting FBI data (crimes reported to law enforcement) and additional measures of local crime from the National Institute of Justice and the Bureau of Justice Statistics.
The FBI is now offering new crime reporting requirements, Counting Crime that will also increase the number of crimes counted (but by a much smaller figure than the National Crime Victimization Survey).
What’s Coming
I believe that the US Department of Justice will use and report on crimes and fear in cities for cities, metropolitan areas and states at some point in the future based on the National Crime Victimization Survey.
This will include measures of local citizen satisfaction with the law enforcement agencies.
How Cities Scored As To Crime, Fear and Police Perceptions
The report below provides a summation citing specific cities and metro areas. It’s best for readers to read the full report (link below) and come to their own conclusions.
Mine include:
There are differences (sometimes major) between cities (regardless of demographics) and surrounding areas. Simply put, those living in cities perceive more crime and less citizen satisfaction with police.
The same cities pop up frequently as to questions of safety and citizen satisfaction with law enforcement.
Most people state that there are concerns about areas within a mile of their homes being unsafe with Baltimore taking the lead.
Most cities score well with workplace safety with Baltimore scoring lowest.
The cities that score the worst in a variety of crime measurements are Baltimore, Detroit, Cleveland, St. Loius, Atlanta and Providence with others registering concerns for some categories.
Most residents give law enforcement high marks for satisfaction (generally speaking, 70 percent or more) with Providence, Detroit, Baltimore and Miami having the lowest scores.
In each of the 40 areas, a majority of respondents who had contacted police while living at their current address indicated being “very” or “mostly” satisfied with the police response.
Most cities state that their police were good or excellent (generally speaking, 70 percent or more) with Providence, Cleveland and Baltimore having the lowest scores.
Most household respondents rated their police department as “excellent” or “good”; this includes both respondents who had contacted police while at their current residence and those who had not.
Again, these are my observations with the understanding that other cities not mentioned scored high on some measures.
The Local Area Crime Survey-Summation by Westat (Contractor)-Funded By the Bureau Of Justice Statistics (slightly edited quotes)
Editor’s note–the timeline of these surveys coincided with significant growing violence after decades of reduced crime, US Crime Rates.
The Local-Area Crime Survey (LACS) was fielded in 2015 and 2016 and published in April of 2021. It collects victimization data and information on perceptions of police and community safety from residents in the 40 largest metropolitan areas in the United States.
The Local-Area Crime Survey was adapted from the National Crime Victimization Survey as part of the Bureau of Justice Statistics (US Department of Justice) efforts to build a program to estimate victimization at subnational (local) levels.
Westat, in collaboration with BJS, proposed a way to develop and evaluate a cost-effective survey of victimization and public perceptions (emphasis added) as one piece of the subnational (local) program.
This report presents aggregate findings from 40 metropolitan areas on perceptions of police and community safety.
Findings from the Local-Area Crime Survey Residents’ include perceptions of their local areas and local police, including how safe they find their neighborhoods to be and how concerned they are about crime, often reflect a complex set of personal and other factors.
To expand knowledge about crime victimization and community and police perceptions at local geographical levels, the Bureau of Justice Statistics (BJS), through a cooperative agreement with Westat, developed and tested a household survey about crime victimization, neighborhood safety, and police performance (emphasis added).
One of the two major statistical programs on crime produced by the U.S. Department of Justice, the National Crime Victimization Survey is the nation’s primary source of information about crime victimization, whether reported or not reported to police. The National Crime Victimization Survey has a limited capacity to produce reliable estimates at the state and local levels prior to the 2016 sample redesign.
The Local-Area Crime Survey is one of several initiatives BJS has undertaken to increase the availability of victimization data of interest to local jurisdictions (emphasis added).
Local areas generally have their own data on victimizations, but these are almost always limited to crimes reported to police. Like the National Crime Victimization Survey, the Local-Area Crime Survey was intended to widen this scope to include all crimes of specified types.
The Local-Area Crime Survey was designed to support estimating changes over time at a local level and cross-sectional comparisons within or across jurisdictions (emphasis added). Such comparisons are impossible with currently available data because practices and reporting procedures vary widely, even within large cities.
In particular, a goal for the Local-Area Crime Survey was to be able to assess differences on these measures within specific geographical areas to provide additional context for variations in local crime and safety patterns.
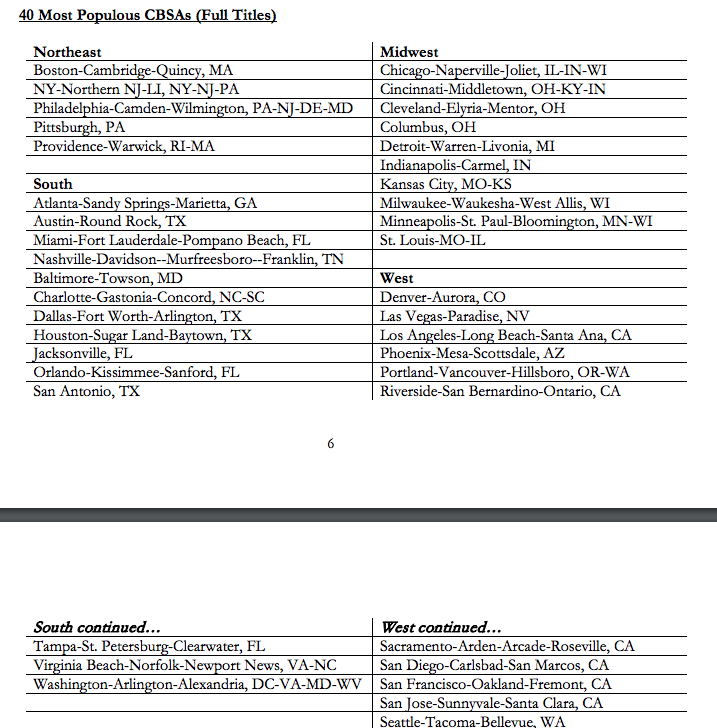
The Local-Area Crime Survey was conducted in 2015 and 2016 in the 40 most populous U.S. metropolitan areas The survey, which was mailed to representative samples of households in these 40 areas, was called the American Crime Survey.
With reference to their local area, it asked household respondents, who answered on behalf of their households, about their perceptions of police, perceptions of community safety, and fear of crime. The survey also collected information on the percentages of households and people that were affected by crime in the prior 12 months as reported by the household respondent.
Metropolitan areas are the Core-Based Statistical Areas (CBSAs) used by the U.S. Census Bureau. A Core-Based Statistical Areas is defined by the U.S. Office of Management and Budget to be the core urban area, “plus adjacent counties having a high degree of social and economic integration with the core as measured through commuting ties with the counties associated with the core.”
Community Item 1: On the whole, how much of the time is the community where you live safe?
Across the 40 areas, the percentage of household respondents saying the community was “always” or “mostly” safe ranged from 85% to 95%.
Generally, households in the major city of the CBSA were less likely to report that their communities were “always” or “mostly” safe compared to residents living outside of the major city.
Virginia Beach was one exception to this pattern, with those in the city being more likely to report feeling that the community was “always” or “mostly” safe than residents in outlying areas (93% versus 87%).
Fourteen of the 40 areas had at least a 15-point difference in perceptions of safety between city dwellers and those residing outside the major city. In these areas—Atlanta, Baltimore, Chicago, Cincinnati, Cleveland, Dallas, Detroit, Indianapolis, Miami, Milwaukee, Philadelphia, Providence, Sacramento, and St. Louis—households in major cities were less likely to report that the community was “always” or “mostly” safe compared to those in outlying areas.
The Detroit area had the largest difference between the major city and outlying areas with 47% of respondents from the city reporting their community as “always” or “mostly” safe compared to 94% of those in outlying areas, a difference of 47 percentage points.
The Baltimore, Cleveland, and Milwaukee areas also had sizable differences between the major city and outlying area of between 30 and 36 percentage points, with lower percentages of residents in these major cities expressing that their community was always or mostly safe.
Community Item 2: Is there any place within a mile of your home where you would be afraid to walk alone at night?
There was variability across areas in the percentage of household respondents living near places where they would be afraid to walk alone at night.
The percentage of respondents who said “no” to this question, or who indicated that they would not be afraid to walk alone at night, ranged from about 45 to 60%.
Areas at the lower end of this range included San Francisco (46%), Houston (46%) and Baltimore (47%), while areas with higher ratings on this item included Kansas City, MO-KS (59%), Boston (59%), Minneapolis-St. Paul (59%), and Detroit (61%).
In addition, there were differences on this measure between respondents in major cities and the outlying areas of these cities.
Most (33) of the 40 metropolitan areas had at least 15-point differences between city dwellers and those from outside the major city. The largest differences between the central city and outside were in the Midwest region, with Cincinnati, Cleveland, Detroit, Indianapolis, Milwaukee, and St. Louis each having a 40-point or larger difference.
The area with the largest difference was Detroit, where 68% of those in outlying areas said there was not a place within a mile of their homes they would be afraid to walk alone at night, while only 13% of those in the city of Detroit expressed similar sentiments, a difference of 55 percentage points.
Community Item 3: How often does fear of crime prevent you from doing things you would like to do?
Areas varied in the proportion of household respondents indicating that fear of crime limited their activities.
Estimates of those for whom fear of crime “never” or “rarely” limited their activities ranged from a low of 71% in Houston to a high of 88% in Minneapolis-St. Paul.
There was less variability in the percentage of respondents stating that fear of crime never or rarely prevented them from doing things they would like to do than the percentage indicating that there was no place within a mile of their home where they would be afraid to walk alone at night.
Eleven metropolitan areas had at least a 15-percentage point difference between city dwellers and those outside the major city on this item. Seven of these were in the Midwest, with Detroit having the greatest difference between those in the major city (36%) and those in the remainder of the CBSA (84%) (48 percentage points). Cleveland also had a relatively large difference with 48% of those in major cities indicating that fear of crime never or rarely limited their activities, compared with 84% of those in outlying areas.
Community Item 4: When you leave your home, how often do you think about it being broken into or vandalized while you’re away?
There was considerable variability across areas in the percentage of household respondents who said they “never” or “rarely” thought about their homes being broken into or vandalized while they were away.
Estimates ranged from a low of 59% of respondents in the Las Vegas area reporting that they “never” or “rarely” think about their homes being broken into or vandalized to a high of 80% in the Washington, D.C., area.
Seven areas had a 15 percentage point or greater difference between major city dwellers and those residing outside the major city. The Detroit area had the largest difference: 42 percent of those in the city of Detroit reported that they “never” or “rarely” worried about their home being broken into or vandalized compared with 78 percent of those in the remainder of the area. The Cleveland area also had a relatively large difference on this measure (49% versus 76%).
Community Item 5: In the past 3 years, do you believe your community has become safer, stayed the same, become less safe, or do you not know?
Across areas, the percentage of household respondents who thought that their community was at least as safe as it was three years ago, that is, who thought it had become safer or stayed the same, ranged from a low of 66% in Indianapolis to a high of 84% in Boston and San Diego.
On this measure of community safety, 10 of the 40 metropolitan areas had a statistically significant difference of 15 percentage points or more between respondents in the major city and those in the remainder of the area, with those in outlying areas being more likely to believe that their community was at least at safe as it was three years prior.
Baltimore and Cleveland each had a percentage-point difference of 24 between major city dwellers and those in outlying areas (50% versus 74% and 52% versus 76%, respectively). Other areas with relatively large differences were in the Midwest: Milwaukee and Indianapolis (23 percentage points each), Detroit (22 percentage points) and St. Louis (21 percentage points).
Community Item 6: Overall, how much of the time is the place where you work safe?
Across the 40 areas, between 84% and 93% of respondents overall reported that their place of work was “always” or “mostly” safe. There was relatively little difference between respondents in the major cities and those in outlying areas for this item.
No metropolitan area had a difference of 15 points or greater between the major city and the outlying area. The largest difference (10 points) was in Baltimore, where 77% of city dwellers reported their workplace as “always” or “mostly” safe compared with 87% of those in outlying areas.
Policing Item 1: While living at this address, have you ever contacted the local police department for assistance?
Overall, less than half of respondents in the 40 areas had contacted police while living at their current address. Between 30 and 45% of respondents across areas indicated that they had contacted the local police at some point while residing at the sampled address.
Three metropolitan areas had a statistically significant spread of 15 percentage points or more between the major city and the remaining area: Cleveland, Detroit, and Miami.
In Miami, those in the surrounding area (36%) were more likely to report contacting the police than those in the major city (20%). This pattern is reversed in Cleveland and Detroit, where higher percentages of city dwellers than those in the surrounding area had contacted local police.
In Cleveland, 57% of those in the major city contacted their local police compared with 42% in the outlying area. Similarly, in Detroit, 57% of those in the major city contacted their local police compared with 38% of those residing outside the major city.
Policing Item 2: If you have contacted the police while living at this address, how satisfied were you with the police response?
In each of the 40 areas, a majority of respondents who had contacted police while living at their current address indicated being “very” or “mostly” satisfied with the police response.
The range of respondents across areas who had contacted the police and indicated that they were “very” or “mostly” satisfied with the police response was about 19 percentage points, with a low of 67% in Los Angeles and a high of 86% in Minneapolis-St. Paul.
In fifteen of the forty metropolitan areas, the difference between the major city and remaining area was greater than 15 percentage points.
This difference exceeded 30 points in Milwaukee, Detroit, and Miami. In Milwaukee, 59% of those in the major city were very/mostly satisfied compared with 90 percent of those residing outside the major city.
In Detroit, 50% of those in the major city reported being very/mostly satisfied with the local police response compared with 83% in the outlying area. In Miami, 42% of those in the major city were very/mostly satisfied compared with 77% of those outside the major city.
Policing Item 3: How would you rate the job the local police department is doing in your community?
Across areas overall, most household respondents rated their police department as “excellent” or “good”; this includes both respondents who had contacted police while at their current residence and those who had not.
These percentages ranged from 75% in San Jose to 92% in MinneapolisSt. Paul. When looking at ratings within specific areas, there was notable variation between respondents in the central cities and the outlying areas.
Sixteen of the 40 CBSAs had a spread of at least 15 percentage points between city dwellers compared with those in outlying areas. In each of these areas, the percentages of those rating the job of the local police as “excellent” or “good” were lower for those in the major city than those in surrounding areas.
In addition, four metropolitan areas had a difference between the major city and outlying area that was larger than 25 percentage points: St. Louis (59%versus 85%), Cleveland (52 vs. 90%), Baltimore (47 vs. 88%) and Detroit (42 vs. 92%)
Source
See More
See more articles on crime and justice at Crime in America.
Most Dangerous Cities/States/Countries at Most Dangerous Cities.
US Crime Rates at Nationwide Crime Rates.
National Offender Recidivism Rates at Offender Recidivism.
The Crime in America.Net RSS feed (https://crimeinamerica.net/?feed=rss2) provides subscribers with a means to stay informed about the latest news, publications, and other announcements from the site.
My book based on thirty-five years of criminal justice public relations,” Success With The Media: Everything You Need To Survive Reporters and Your Organization” available at Amazon and additional booksellers.
This is an ad-free website.
Reviews are appreciated
2 Replies to “DOJ May Publish The Most Dangerous And Fearful Cities Plus Opinions Of Police Agencies”