
Highlights
The overwhelming majority of violence doesn’t involve firearms.
When firearms are used, the overwhelming majority of violence (including mass shootings) is committed with handguns.
The number of nonfatal firearm shootings involving a handgun decreased.
Author
Article
The Bureau of Justice Statistics of the US Department of Justice released an overview of firearm violence (link below) from 1993 to 2018. The numbers examined are huge; they apply to today’s crime issues.
This article provides a practitioner-friendly summation of that report.
It starts with an overview of the multi-year reductions in firearm violence. Per the Bureau of Justice Statistics victimization survey, violence decreased considerably over a 20-year period until 2015-2018 when violence (and serious violence) increased by 28 percent (with decreases in 2019-2020), partially kicking off our current increase in violence.
There was a nearly 30 percent increase in homicides in 2020 based on crimes reported to law enforcement via the FBI. Overall violence increased by 5.6 percent. Media reports indicate considerable and growing rates of violence and fear of crime concentrated in cities in 2021 and 2022.
The 2020 yearly crime reports from the Bureau of Justice Statistics and the FBI are the latest available federal data.
The Bureau of Justice Statics uses a survey (the National Crime Victimization Survey) to collect its data because only 40 percent of violent crimes (including simple assault) are reported to law enforcement. See Violent And Property Crime In The US for a review of crime statistics from the Bureau of Justice Statistics and the FBI.
Considering that the Bureau of Justice Statistics survey doesn’t include homicides (you can’t interview dead people), that data usually comes from the FBI but the numbers in this report are primarily from mortality data in the Center for Disease Control and Prevention’s (CDC) Web-based Injury Statistics Query and Reporting System based on death certificates in the National Vital Statistics System (NVSS) of the National Center for Health Statistics.
Readers are encouraged to read the full report (link below). I provide a brief overview.
Polls vary on the number of firearms in private hands in the United States. The estimates range from 350 to 400 million with the vast majority being Constitutionally protected handguns, shotguns, and hunting rifles. “Controlling” private firearms is a daunting challenge considering the vast majority of gun violence involves handguns, not commonly discussed assault weapons. Even if handguns were banned (impossible because of Constitutional and court protections) it would take a lifetime for prohibitions to be effective.
I provide a user-friendly summation below. Bureau of Justice Statistics reports need to be read carefully. Terms used include fatal or nonfatal violence, firearm and nonfirearm violence, and the report seems to exclude simple assaults, the largest category of violence. I use italicized words for clarity that are mine, not from BJS. I include editors’ notes throughout for clarity. Most of what’s below uses exact but rearranged verbiage from the report.
Nonfatal firearm violence includes rape or sexual assault, robbery, and aggravated assault victimizations against persons age 12 or older in which the offender had, showed, or used a firearm.
Quick Overview
The current national discussion regarding violent crime focuses on “gun violence” when the overwhelming majority of violence doesn’t involve firearms (excluding homicides).
The current national discussion focuses on “assault weapons” when the overwhelming majority of violence when firearms are present (including mass shootings) is committed with handguns.
The current national discussion involves an explosion of gun violence where the number of nonfatal firearm victimizations involving a handgun decreased up to 2018 (the final year used for the report). It contradicts the narrative of an explosion in gun violence.
The firearm homicide rate was the highest (by far) for Black Americans. Patterns of nonfatal firearm violence by victim characteristics were generally similar to those for firearm homicides.
The share of Black Americans in nonfatal firearm incidents was higher for both victims and perceived offenders than their share of the population.
40 percent of nonfatal firearm violence is committed by offenders known to the victim.
About 40 percent of nonfatal firearm violence occurred in or near the victim’s home.
Violent and property victimizations involving the theft of at least one firearm declined from 277,700 in 1993 to 125,400 in 2018. It contradicts the narrative that firearm thefts are increasing.
Overall, victims were more likely to suffer physical injury in nonfatal violence without a firearm.
A firearm was used for self-defense in 2% of nonfatal violent victimizations.
The Vast Majority Of Violence Doesn’t Involve Firearms
From 1993 to 2018, an annual average of 8% of all fatal and nonfatal violence involved a firearm. The average percentage of nonfatal violence that involved a firearm was 7%. On average, 71% of homicides were committed with a firearm. During the same period, an annual average of 22% of nonfatal violence, excluding simple assault (editors note: simple assaults are the majority of violence), involved a firearm, including 23% of robberies and 27% of aggravated assaults.
Handguns Power Violent Crime
In 2018, an estimated 7,600 firearm homicides were committed with a handgun. The percentage of all firearm homicides that were committed with a handgun decreased from 82% in 1993 to 64% in 2018. The trend was also consistent for firearm homicides against persons age 12 or older.
As was the case for firearm homicides, handguns were involved in the majority of nonfatal firearm violence.
Though the average number of nonfatal firearm victimizations involving a handgun decreased from 1.3 million in 1993–95 to 432,800 in 2016–18, the percentage of nonfatal firearm victimizations involving a handgun was not statistically different from 1993–95 (89%) to 2016–18 (92%).
Other types of firearms, such as shotguns and rifles, accounted for the remainder of both fatal and nonfatal firearm violence during these periods.
Young Males And African Americans Were Primary Victims Of Firearm Violence
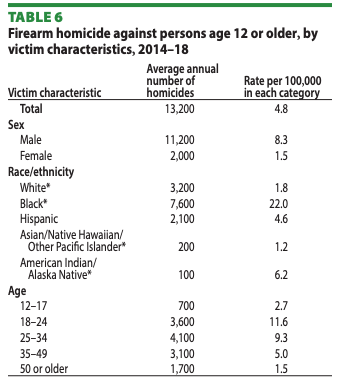
Males were victims of fatal and nonfatal firearm violence at higher rates than females. During 2014–18, an average of 13,200 firearm homicides occurred annually. The overall rate of firearm homicide was 4.8 per 100,000 persons age 12 or older.
The firearm homicide rate was higher for males (8.3 per 100,000 males) than females (1.5 per 100,000 females).
Based on rates among population groups, the firearm homicide rate was higher for black persons (22.0 per 100,000) than white (1.8 per 100,000), Hispanic (4.6 per 100,000), Asian or Pacific Islander (1.2 per 100,000), and American Indian or Alaska Native (6.2 per 100,000) persons.
The rate was also higher for persons ages 18 to 24 (11.6 per 100,000) than for persons in all other age groups. The rate of nonfatal firearm violence was 1.6 victimizations per 1,000 persons age 12 or older during 2014–18.
Patterns of nonfatal firearm violence by victim characteristics were generally similar to those for firearm homicides.
Chart-Homicide Victims
40 Percent Of Nonfatal Firearm Violence Are Committed By Known Offenders
During 2014–18, strangers committed a greater percentage of nonfatal firearm violence than nonstrangers. During 2014–18, the victim-offender relationship and number of offenders were known in 1.9 million victimizations involving nonfatal firearm violence.
Strangers committed a greater percentage of nonfatal firearm violence (60%) than known offenders (40%).
In comparison, strangers committed 39% of the 7.3 million nonfirearm violent victimizations during 2014–18, while known persons committed 61% (editor’s note-thus solidifying the fact that the majority of overall violent crime is committed by someone the victim knows).
Similar to nonfatal firearm violence, friends and acquaintances (35%) committed a greater percentage of nonfirearm violence than intimate partners (18%) and other relatives (8%).
Intimate partners committed a greater percentage of nonfirearm violence than other relatives. Known offenders include persons known to the victim, such as current or former intimate partners, other relatives, and friends or acquaintances. Friends or acquaintances committed a greater percentage of nonfatal firearm violence (25%) than intimate partners (9%) and other relatives (7%).
Your House Can Be A Dangerous Place
About 40% of nonfatal firearm violence occurred in or near the victim’s home during 2014–18. There were 2.2 million nonfatal firearm victimizations. About 40% of all nonfatal violence excluding simple assault occurred in or near the victim’s home, whether it involved a firearm or not.
Theft Of Firearms
Violent and property victimizations involving the theft of at least one firearm declined from 277,700 in 1993 to 125,400 in 2018. The number of victimizations involving the theft of items excluding firearms decreased during this period, from 32.3 million to 12.2 million.
In addition, an annual average of 1% of all theft victimizations from 1993 to 2018 involved the theft of firearms. From 2014 to 2018, about 777,100 victimizations (an annual average of 155,400) involved the theft of at least one firearm.
About 1.2 million firearms (an annual average of 249,400) were stolen during violent, property, and personal larceny victimizations during this five-year period.
Victims More Likely To Suffer Physical Injury In Nonfatal Violence Without A Firearm
During 2014–18, about 16% of nonfatal firearm victimizations resulted in physical injury. In 9% of all nonfatal firearm violence during 2014–18, the offender actually fired the weapon. In 23% of these victimizations, the victim suffered a gunshot wound (editor’s note: most offenders are wildly inaccurate shooters).
A total of 16% of nonfatal firearm victimizations resulted in physical injury. About 5% of nonfatal firearm victimizations resulted in serious injury (e.g., gunshot wounds, broken bones, or internal injuries), while 11% resulted in minor injury (e.g., bruises or cuts).
Victims received medical treatment in 47% of these victimizations.
Overall, victims were more likely to suffer physical injury in nonfatal violence without a firearm (40%) than in firearm victimizations (16%).
Most Reported To Law Enforcement
Nearly 70% of nonfatal firearm violence during 2014–18 was reported to police. During 2014–18, nonfatal firearm violence (68%) was more likely to be reported to police than nonfirearm violence (49%). Editor’s note, currently, 40 percent of all violent crimes are reported to law enforcement-includes simple assault.
For firearm victimizations that were not reported to police, the most common reason victims gave was a belief that police could not or would not do anything to help (32%). The most common reason victims of nonfirearm violence gave for not reporting to police was that they had dealt with the victimization another way, such as reporting to another official, like a guard, manager, or school official (28%).
Victims of firearm violence (32%) were more likely than victims of nonfirearm violence (20%) to not report to police because they believed the police could not or would not do anything to help. Similarly, victims of firearm violence (15%) were more likely than victims of nonfirearm violence (8%) to fear reprisal for reporting.
A Firearm Was Used For Self-Defense In 2 Percent Of Nonfatal Violent Victimizations
A firearm was used for self-defense in 2% of nonfatal violent victimizations. The National Crime Victimization Survey collects data on victims’ reactions and any actions they may have taken during the incident. During 2014–18, the victim took no action against the offender or kept still in 37% of all nonfatal violence excluding simple assault.
Other self-protective behaviors included noncombative tactics (31%) (such as yelling, running away, or trying to attract attention) and threatening or attacking the offender without a weapon (25%).
Victims used a firearm to threaten or attack the offender in 2% (166,900) of all nonfatal violent victimizations; the offender had a firearm in 28% of these cases.
In 1% (183,300) of property victimizations during which the victim was present, the victim threatened or attacked the offender with a firearm. However, the victim was not present during the majority (82%) of property crimes.
Offenders Using Firearms
There were 1.9 million incidents of nonfatal violence excluding simple assault—rape or sexual assault, robbery, and aggravated assault—during 2014–18 in which the offender had, showed, or used a firearm.
The Share Of Black Persons In Nonfatal Firearm Incidents Was Higher For Both Victims And Offenders Than Their Share Of The Population
The share of black persons in nonfatal firearm incidents was higher for both victims and perceived offenders than their share of the population during 2014–18.
During 2014–18, the percentage of nonfatal firearm incidents involving white victims (53%) was smaller than the percentage of white persons in the population (64%).
In comparison, the percentage of firearm incidents involving black victims (21%) was larger than the percentage of black persons in the population (12%).
For offenders, the percentage of nonfatal firearm incidents during 2014–18 with persons perceived by the victim to be white (30%) was half their share of the population, while the percentage with persons perceived by the victim to be black (37%) was greater than the percentage of black persons in the population (editor’s note-12.5 percent).
Nearly twice (1.8 times) as many nonfatal firearm incidents involved black offenders as black victims during 2014–18. In comparison, around half (0.6 times) as many firearm incidents involved white offenders as white victims.
Source
See More
See more articles on crime and justice at Crime in America.
Most Dangerous Cities/States/Countries at Most Dangerous Cities.
US Crime Rates at Nationwide Crime Rates.
National Offender Recidivism Rates at Offender Recidivism.
An Overview Of Data On Mental Health at Mental Health And Crime.
The Crime in America.Net RSS feed (https://crimeinamerica.net/?feed=rss2) provides subscribers with a means to stay informed about the latest news, publications, and other announcements from the site.