

Highlights
The rate of violent hate crime in the United States in 2019 (1.0 hate crimes per 1,000 persons age 12 or older) was not significantly different from the rate in 2005 (0.8 per 1,000)-National Crime Victimization Survey. The great majority of hate crimes are violent.
59% of violent hate crime victimizations reported by victims were motivated by bias against their race, ethnicity or national origin-National Crime Victimization Survey.
Whites and older persons were the primary victims of violent hate crimes-National Crime Victimization Survey (2010-2019).
Author
Article
The article below was created via data from the Bureau of Justice Statistics of the US Department of Justice through the National Crime Victimization Survey including a press release, a summation, and a full report (sources below).
There are endless media articles and reports as to hate crimes exploding in numbers, but what about rates?
The data below is more than a bit confusing and has to be read carefully as to rates and numbers and measurement periods.
Numbers will increase over time because the population of the United States increases, thus rates should be our primary guide. For example, the U.S. population increased by 10 percent between 2000 and 2010 and is projected to increase by 8 percent between 2010 and 2020, from 309 million to 333 million. More people means higher numbers for anything measured, including hate crimes.
Difference Between FBI and National Crime Victimization Numbers
The Bureau of Justice Statistics collects data through a national survey of “all” crimes where the FBI offers data as to crimes reported to law enforcement.
Because the vast majority of overall violent crimes are not reported to law enforcement, and the fact that this holds true for hate crimes, there is going to be a significant variation as to the numbers.
Note that the National Crime Victimization Survey is going to record much higher numbers than crimes reported to law enforcement as reported through the FBI. The National Crime Victimization Survey records crimes regardless if they are reported to law enforcement or not.
Results will differ based on National Crime Victimization data (all crime) compared to the small percentage of crimes reported to law enforcement. The methodology used by the National Crime Victimization Survey is in the full report (source below).
Quick Summation Of Results
From 2010 to 2019, the number of hate crimes recorded by law enforcement rose 10% (from 6,628 to 7,314 incidents) where the rate of hate crimes via the National Crime Victimization Survey was mostly flat.
Per the National Crime Victimization Survey, violent hate crimes rates (most hate crimes are violent) was 0.8 in 2005 and 1.0 in 2019. Property hate crimes rates were also flat.
Thus over time, the rate of hate crimes was mostly flat, hardly the horrific observations offered by most news organizations.
Older Whites (with an almost even split between females and males) were the primary victims of violent hate crimes (chart below), again, not what you read via news accounts.
Context-Background
Hate crimes are disgusting and those who perpetrate them are equally heinous.
Even though religion accounts for 9 percent of hate crimes, my Jewish friends have been living with hate for centuries.
The number of Asian victims is relatively small but I have no doubt that they have suffered immensely during the pandemic. The history of prejudice towards African-Americans is horrific.
The discussion of hate crimes is more context and harm than numbers or rates.
Nevertheless, rates are important to understand the extent of the problem.
Results could be different when studying a five-year period versus the full report from 2005 to 2019.
The FBI and the Bureau of Justice Statistics are the principal sources of annual information on hate crime in the United States and use the definition established by the Hate Crime Statistics Act of 1990 (28 U.S.C. § 534). See the full report.
Bureau Of Justice Statistics-US Department of Justice-National Crime Victimization Survey (NCVS)
The rate of violent hate crime in the United States in 2019 (1.0 hate crimes per 1,000 persons age 12 or older) was not significantly different from the rate in 2005 (0.8 per 1,000) per the Bureau of Justice Statistics.
During the 5-year aggregate period of 2015-19, nearly 90% of all hate crimes captured by the NCVS were violent crimes, while 10% were property crimes.
This is based on data reported by victims in the National Crime Victimization Survey (NCVS). During the 15-year period from 2005 to 2019, the rate of violent hate crime victimizations fluctuated, ranging from about 0.6 to 1.1 per 1,000.
On average, U.S. residents experienced approximately 246,900 hate crime victimizations each year between 2005 and 2019.
The number of total, violent and property hate crime victimizations did not change significantly from 2005 to 2019.
Overall, hate crime victimizations accounted for 1.6% of all nonfatal victimizations in 2019, up from 0.9% in 2005.
Victims indicated that nearly two-thirds (62%) of hate crimes during 2015-19 were simple assaults.
Reasons For Hate Crimes
During the 5-year period of 2015-19, an estimated 59% of violent hate crime victimizations reported by victims were motivated by bias against their race, ethnicity or national origin. This was the most commonly reported motivation for violent hate crime.
In nearly a quarter of violent hate crime victimizations, victims believed they were targeted because of bias against their gender (24%), against persons or groups they were associated with (23%), or against their sexual orientation (20%).
Approximately 1 in 10 violent hate crime victimizations were thought to be motivated by bias against the victim’s disability (11%) or religion (9%).
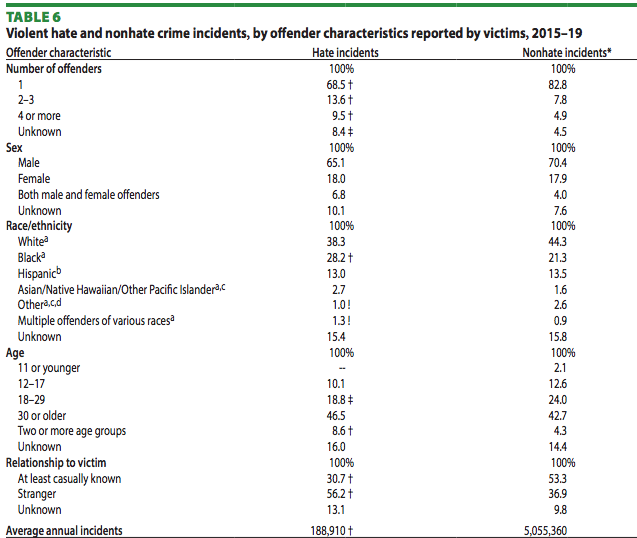
Additionally, victims reported that more than half (56%) of violent hate crimes were committed by a stranger during the 5-year period of 2015-19. That means that a significant number of hate crimes involved people the victim knew.
Victims also reported that a greater portion of violent hate crimes (23%) than violent non-hate crimes (13%) during this period involved multiple offenders.
FBI Numbers-Hate Crimes Reported To law Enforcement Increased
During 2015-19, approximately 42% of violent hate crime victimizations were not reported to police. (Editor’s note-this is a much higher percentage of crimes reported compared to overall violent crime).
From 2010 to 2019, the number of hate crimes recorded by law enforcement rose 10% (from 6,628 to 7,314 incidents), according to the FBI’s Uniform Crime Reporting Hate Crime Statistics Program (HCSP). (Editor’s note-this approximates the overall US population increase).
By comparison, the total volume of law enforcement recorded crimes — including both hate and nonhate incidents — decreased 22% during the 10-year period from 2010 to 2019. (Editor’s note-violent crime increased 28 percent since 2015 per the National Crime Victimization Survey).
Race-Ethnic Background
Similar to the motivation for hate crimes reported in the NCVS, race, ethnicity or ancestry bias accounted for most (about 54%) hate crimes recorded by law enforcement from 2010 to 2019.
Victims suspected that offender(s) were motivated by race, ethnicity, or national origin bias in 59% of violent hate crime victimizations during 2015-19-National Crime Victimization Survey.
During the 5-year period of 2015-19, nearly half (49%) of these incidents were motivated by anti-black or anti-African American bias (per data reported to law enforcement). See press release.
During that same time period, law enforcement recorded increases in the number of hate crime victims of black or African-American (from 2,201 to 2,391 victims), Asian (from 136 to 215), and Arab descent (from 48 to 126).
Chart-Rates And Numbers-National Crime Victimization Survey-Open Image in A New Tab To Enlarge
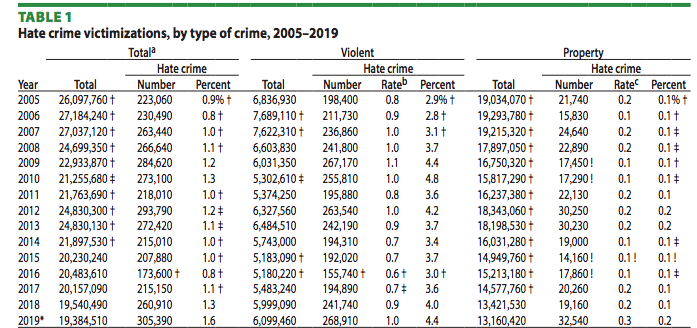
Chart-Who Is Victimized By Hate Crimes-National Crime Victimization Survey-Open Image in A New Tab To Enlarge
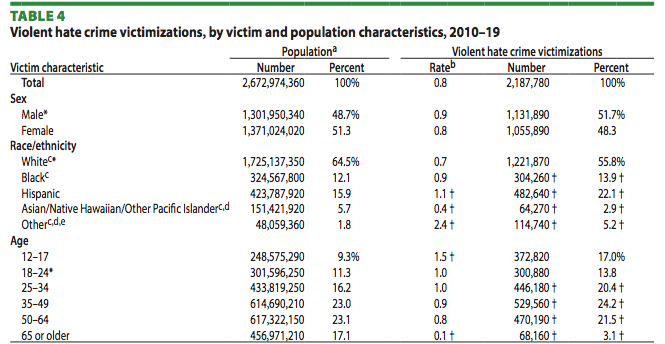
Chart-Who Is Victimized By Hate Crimes-National Crime Victimization Survey-Open Image in A New Tab To Enlarge
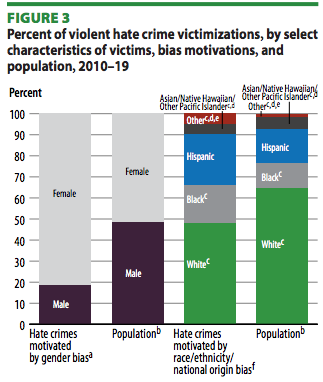
Chart-Who Is Committing Hate Crimes-National Crime Victimization Survey-Open Image in A New Tab To Enlarge
Sources
Bureau Of Justice Statistics-Summation
Bureau Of Justice Statistics-Full Report
Bureau Of Justice Statistics-Press Release
See More
See more articles on crime and justice at Crime in America.
Most Dangerous Cities/States/Countries at Most Dangerous Cities.
US Crime Rates at Nationwide Crime Rates.
National Offender Recidivism Rates at Offender Recidivism.
An Overview Of Data On Mental Health at Mental Health And Crime.
The Crime in America.Net RSS feed (https://crimeinamerica.net/?feed=rss2) provides subscribers with a means to stay informed about the latest news, publications, and other announcements from the site.
One Reply to “Hate Crimes Rates Haven’t Increased Per USDOJ”