

Highlights
This article is available as a podcast on YouTube.
There are huge differences in the rates of violence and property victimization per state.
This is an overview of violent and property victimization for the 3-year periods of 2017–19 and 2020–22 in the 22 largest U.S. states per the Bureau of Justice Statistics.
There is a point where Artificial Intelligence could analyze data in real time by location, and law enforcement agencies could convey information to citizens on a real-time basis.
Crime in America.Net-Chat GPT’s “Top 10 Sources for Crime in America” based on primary statistical sources with trusted secondary analysis.
Author
Crime in America.Net-“Trusted Crime Data, Made Clear.”
Quoted by The Associated Press, USA Today, A&E Television, the nationally syndicated Armstrong Williams Television Show (30 times), Department of Justice documents, US Supreme Court briefs, C-SPAN, the National Institute of Health, college and university online libraries, multiple books and journal articles, The Huffington Post, JAMA, The National Institute of Corrections, The Office of Juvenile Justice And Delinquency Prevention, The Bureau of Justice Assistance, Gartner Consulting, The Maryland Crime Victims Resource Center, The Marshall Project, The Heritage Foundation via Congressional testimony, Law Enforcement Today, Law Officer.Com, Blue Magazine, Corections.Com, Prison Legal News, The Hill (newspaper of Congress), the Journal of Offender Monitoring, Inside Edition Television, Yomiuri Shimbun (Asia’s largest newspaper), LeFigaro (France’s oldest newspaper), Oxygen and allied publications, Forbes, Newsweek, The Economist, The Toronto Sun, Homeland Security Digital Library, The ABA Journal, The Daily Express (UK) The Harvard Political Review, The Millennial Source, The Federalist Society, Lifewire, The Beccaria Portal On Crime (Europe), The European Journal of Criminology, American Focus and many additional publications.
Sign up for notice of new articles on the front page of this site.
A comprehensive overview of crime for recent years is available at Violent and Property Crime Rates In The U.S.
Article
New data from the Bureau of Justice Statistics of the US Department of Justice compares the rate of violent and property victimization per 1,000 persons age 12 or older in the 22 largest states for recent years. It’s based on the National Crime Victimization Survey. It represents 79 percent of the U.S. population age 12 or older and 77% of the violent victimizations captured by the NCVS.
States Included
This report presents selected state-level estimates of violent and property victimization for the 3-year aggregate periods of 2017–19 and 2020–22 in the 22 largest U.S. states: Arizona, California, Colorado, Florida, Georgia, Illinois, Indiana, Maryland, Massachusetts, Michigan, Minnesota, Missouri, New Jersey, New York, North Carolina, Ohio, Pennsylvania, Tennessee, Texas, Virginia, Washington, and Wisconsin
National Crime Victimization Survey
The data below is from the National Crime Victimization Survey from the Bureau of Justice Statistics of the US Department of Justice. It’s vastly different from crimes reported to law enforcement compiled by the FBI.
The great majority of crimes are not reported to the police; thus, the US Department of Justice, the criminological community, and journalists over 50 years ago insisted that there needed to be a more accurate method to gauge crime in America.
In essence, the National Crime Victimization Survey is based on questions to a representative sample of citizens of the US, much like Gallup or Pew, or any other reputable survey service.
It’s a count of “all” crime. not a count of “reported” crime via the FBI or independent analysts.
“The National Crime Victimization Survey (NCVS) is the nation’s primary source of information on criminal victimization,” according to the US Census Bureau. It uses Census methodology. To my knowledge, no one disputes the US census and its data, yet most policymakers and journalists ignore the NCVS.
President Trump, as a candidate, used NCVS data to substantiate his claim that violent crime increased, which it did via a record increase for the last two official reporting periods. A new NCVS will be offered soon.
Per the US Department of Justice, rates for violent crime rose approximately 44 percent (per analyst Jeff Asher and The Marshall Project) in 2022, and rates were essentially the same in 2023 per the National Crime Victimization Survey. Note: Chat GPT puts the increase at 42 percent.
It’s the largest increase in violent crime in our nation’s history, based on my decades of offering data on national crime statistics.
Geo-Locating Crime-Crime And Locations
The Bureau of Justice Statistics has experimented with crime rates and totals for cities, counties, and metropolitan areas for years. To my knowledge, this is the first state report. Ordinarily, the NCVS was offered as a national report only. Some in the criminological community see advantages in matching NCVS data with locations as a more accurate guide to state and local crime. See an overview of previous geo-location research at the bottom of “City and State Crime Rates-Most Dangerous Cities.”
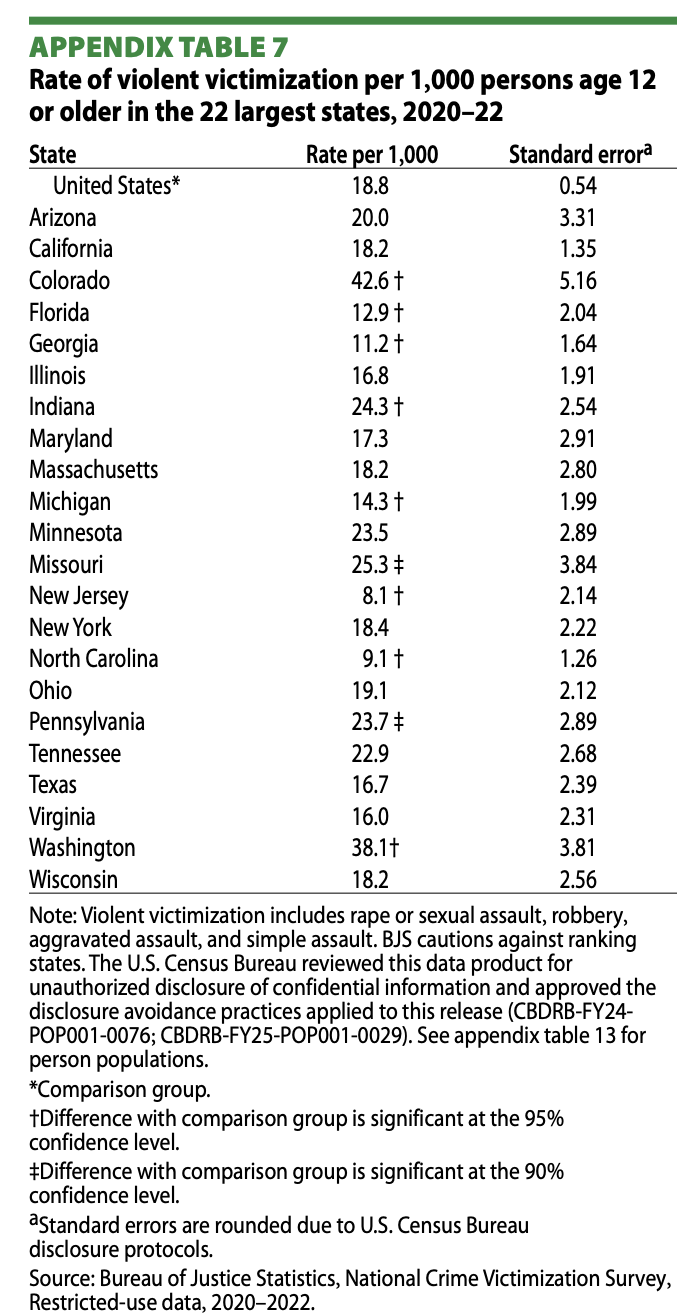
The 22 Largest States and Violent Victimization
The Bureau of Justice Statistics report focuses on crime differences between 2017–19 and 2020–22, and it was published in August of 2025.
The focus of this article will be on the rates of violent and property crime for the 2020-2022 period for the cited states.
There are huge differences in the rate of violent victimization per 1,000 persons between states, ranging from the highest (Colorado) to the lowest (New Jersey).
The top ten most violent states per 1,000 people age 12 or older during the measurement period were:
- Colorado-42.6
- Washington-38.1
- Missouri-25.3
- Indiana-24.3
- Pennslyvania-23.5
- Minneota-23.5
- Tennessee-22.9
- Arizona-20.0
- Ohio-19.1
- New York-18.4
The lowest states for violence included New Jersey (8.1) and North Carolina (9.1).
Chart
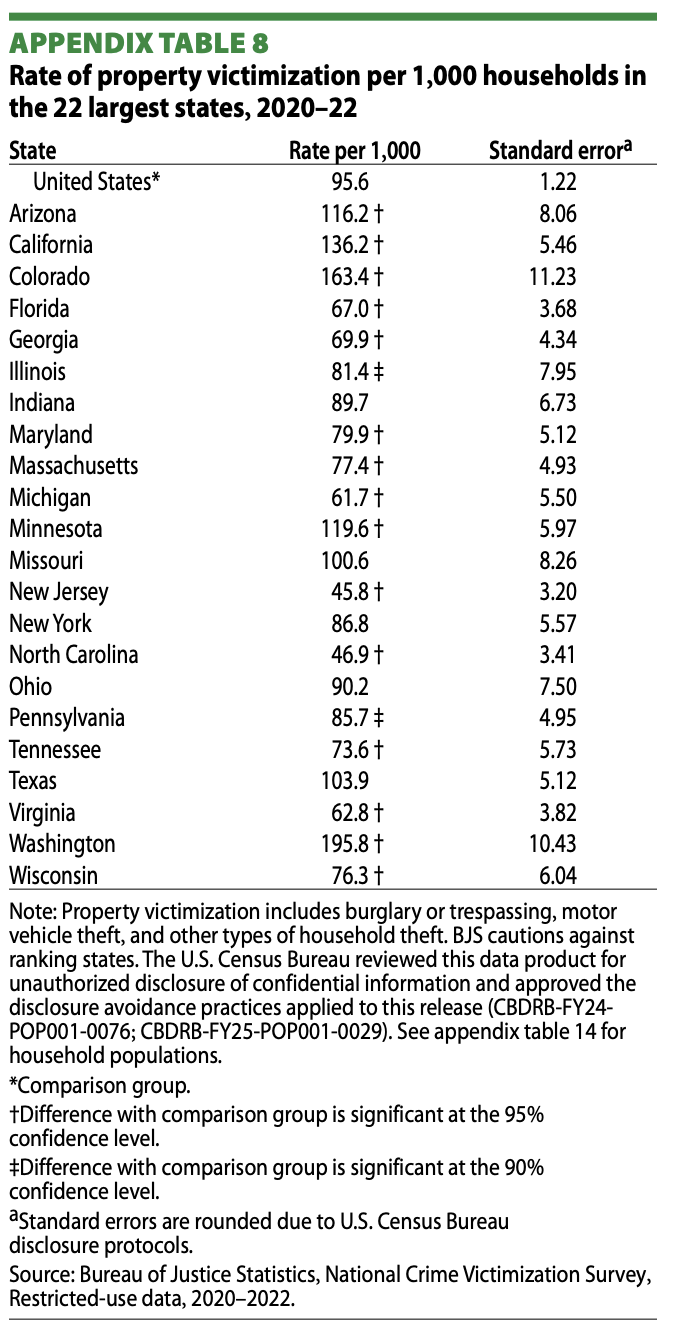
The 22 Largest States and Property Victimization
There are huge differences in the rate of property victimization per 1,000 persons age 12 or older between states, ranging from the highest (Washington) to the lowest (North Carolina).
The top ten highest states for property victimization during the measurement period were:
- Washington-195.8
- Colorado-163.4
- California-136.2
- Minnesota-119.6
- Arizona-116.2
- Texas-103.9
- Missouri-100.6
- Ohio-90.2
- Indiana-89.7
- New York-86.8
The lowest states for property crime were: New Jersey-45.8, North Carolina-46.9, and Michigan-61.7
Chart
Reported Violent Crime
About 2 in 5 violent victimizations (42%) were reported to police nationwide during the 2020–22 time period, which was similar to the percentage for the 2017–19 time period. The percentage of violent victimizations reported to police declined in Indiana from 2017–19 (46%) to 2020–22 (31%) and did not change significantly in the other 21 states.
Across the 22 largest states, the percentage of violent victimizations reported to police ranged from 30% in Wisconsin to 53% in Ohio during 2020–22. The percentage of violent crimes reported to police was higher than the national percentage in one state, Ohio (53%), and lower in three: Indiana (31%), Washington (31%), and Wisconsin (30%).
Reported Property Crime
During the 2020–22 aggregate time period, 32% of property victimizations in the United States were reported to police, which was similar to the percentage during 2017–19. The percentage of property crimes reported to police declined in three states between 2017–19 and 2020–22: Arizona (32% to 24%), Florida (39% to 28%), and Pennsylvania (31% to 24%).
The share of property victimizations reported to police across the 22 largest states ranged from 24% in Arizona to 42% in North Carolina during 2020–22. The percentage of property crimes reported to police exceeded the national percentage in three states: Missouri (39%), North Carolina (42%), and Tennessee (37%) and was less than the national percentage in five states: Arizona (24%), Maryland (25%), Massachusetts (26%), New York (25%), and Pennsylvania (24%).
Only 38 Percent of Urban Crimes Are Reported To Law Enforcement
The 38% figure comes from a BJS report titled “Reporting to Police by Type of Crime and Location of Residence, 2020–2023″. The report breaks down reporting rates by area type:
-
Urban areas: approximately 38% of violent victimizations were reported to police
-
Suburban areas: about 43%
-
Rural areas: around 51%
One Reply to “Most Dangerous States-Criminal Victimization By State”