
U.S. state and federal prisons held an estimated 1,561,500 inmates on December 31, 2014, a decrease of 15,400 prisoners (one percent) since yearend 2013, the Justice Department’s Bureau of Justice Statistics (BJS) announced. This decline reversed the increase observed between 2012 and 2013.
Twenty-three states increased their prison populations.
The federal prison population accounted for almost a third of the total decline in the number of prisoners at yearend 2014. There were 5,300 fewer prisoners in federal facilities on December 31, 2014, than on the same day in 2013. This was the second consecutive decline in the federal prison population since 2012. States held 10,100 fewer inmates at yearend 2014.
The number of males sentenced to more than one year decreased in 22 states and the federal Bureau of Prisons (BOP), and the sentenced female population decreased in 17 states and the BOP. The number of females sentenced to more than one year in state or federal prison increased by almost two percent between 2013 and 2014. This was the largest number of female prison inmates (106,200) since 2008 (106,400).
Mississippi had the greatest percentage decrease in its sentenced prison population in 2014—down 14 percent (2,900 inmates) from year end 2013. Texas, Louisiana and New York all held at least 1,000 fewer prisoners on December 31, 2014, than they did on the same day in 2013. Arizona had the largest increase in number of prisoners, with 1,100 additional inmates in 2014.
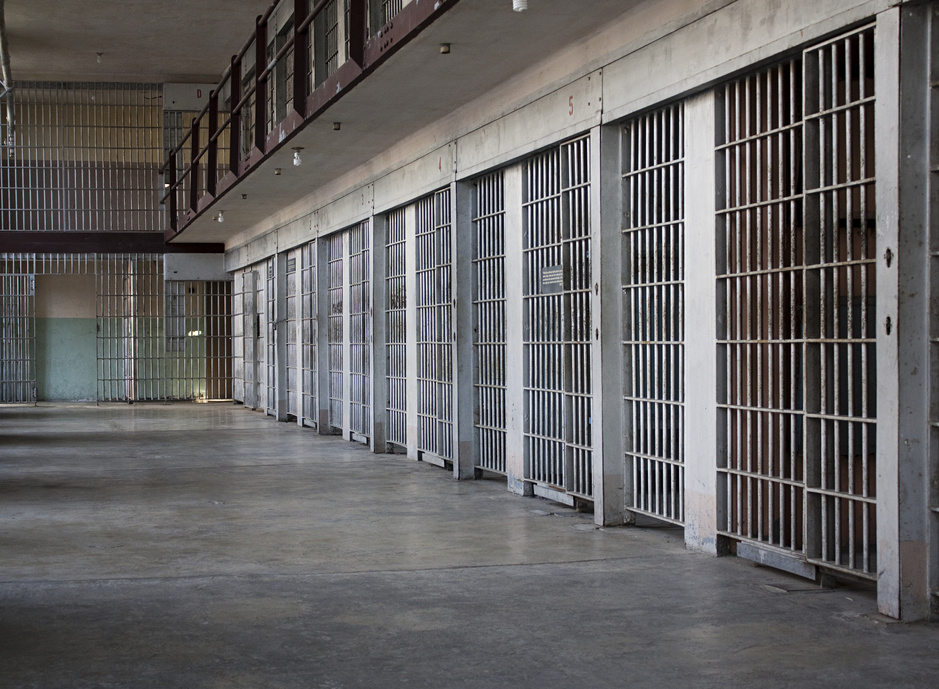
Eighteen states and the BOP were operating at more than 100 percent of their maximum prison facility capacity at yearend 2014, and seven states housed at least 20 percent of their prison population in privately operated facilities (New Mexico, Montana, Oklahoma, Hawaii, Mississippi, Vermont and North Dakota). Since BJS began tracking the number of prisoners in private prisons on an annual basis, the size of this population has grown 90 percent—from 69,000 prisoners in 1999 to 131,300 in 2014. The use of private prisons was at a maximum in 2012, when almost nine percent of the total U.S. prison population (137,200 inmates) were housed in private facilities.
In 2014, almost seven percent of state prisoners and 19 percent of federal prisoners were held in private facilities.
The total imprisonment rate for those sentenced to more than a year in state or federal prison decreased from 477 per 100,000 U.S. residents of all ages in 2013 to 471 in 2014. Among U.S. residents age 18 or older, 612 people per 100,000 were imprisoned on December 31, 2014, down from 621 at year end 2013.
An estimated 516,900 black males were in state or federal prison on December 31, 2014, on sentences of more than one year, which was 37 percent of the sentenced male prison population. White males made up an additional 32 percent of the male population (453,500 prison inmates), followed by Hispanic males (308,700 inmates or 22 percent). White females in state or federal prison at yearend 2014 (53,100 prisoners) outnumbered black (22,600) and Hispanic females (17,800) combined.
Other key findings include—
- Ten percent of the sentenced prison population was age 55 or older (151,500 prisoners), while two percent was age 65 or older (34,000 prisoners).
- In 2013, the most recent year for which offense data were available for the state prison population, 16 percent of state prisoners were serving sentences for drug offenses, while the majority of state prisoners (53 percent) were convicted violent offenders.
- Seven percent of federal prisoners were serving sentences for violent offenses and 50 percent for drug offenses on September 30, 2014.
The report, Prisoners in 2014 (NCJ 248955), can be found at http://www.bjs.gov/.