

Highlights
Arizona, Colorado, and Washington states have much higher rates of violence when compared to other large states.
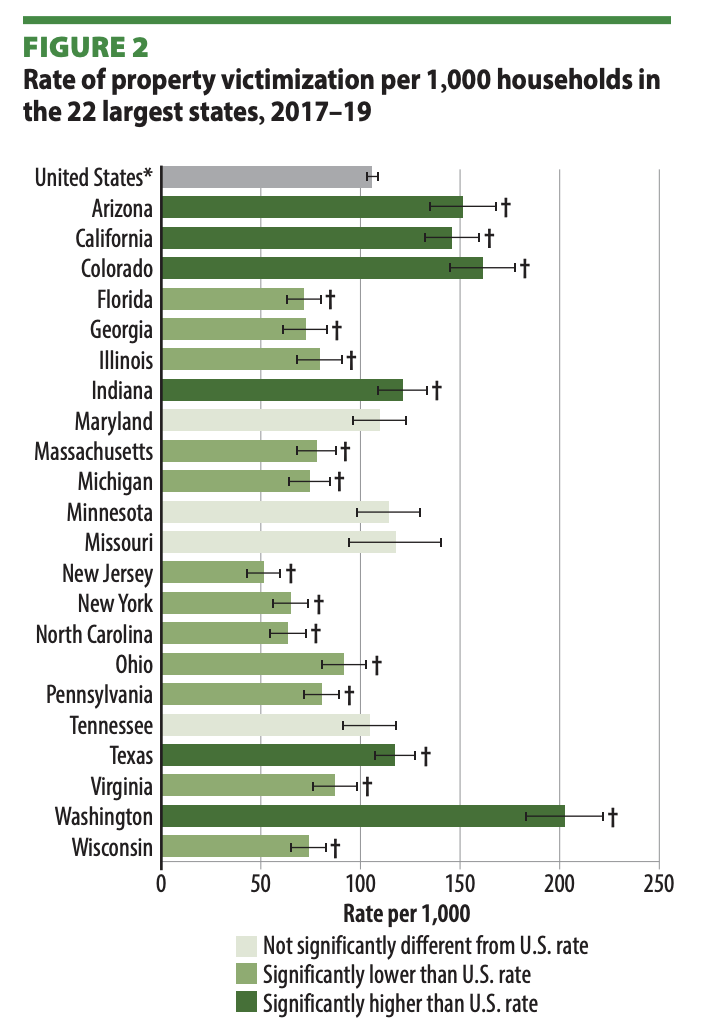
Arizona, Colorado, California, Indiana, Texas, and Washington have much higher rates of property crimes when compared to other large states.
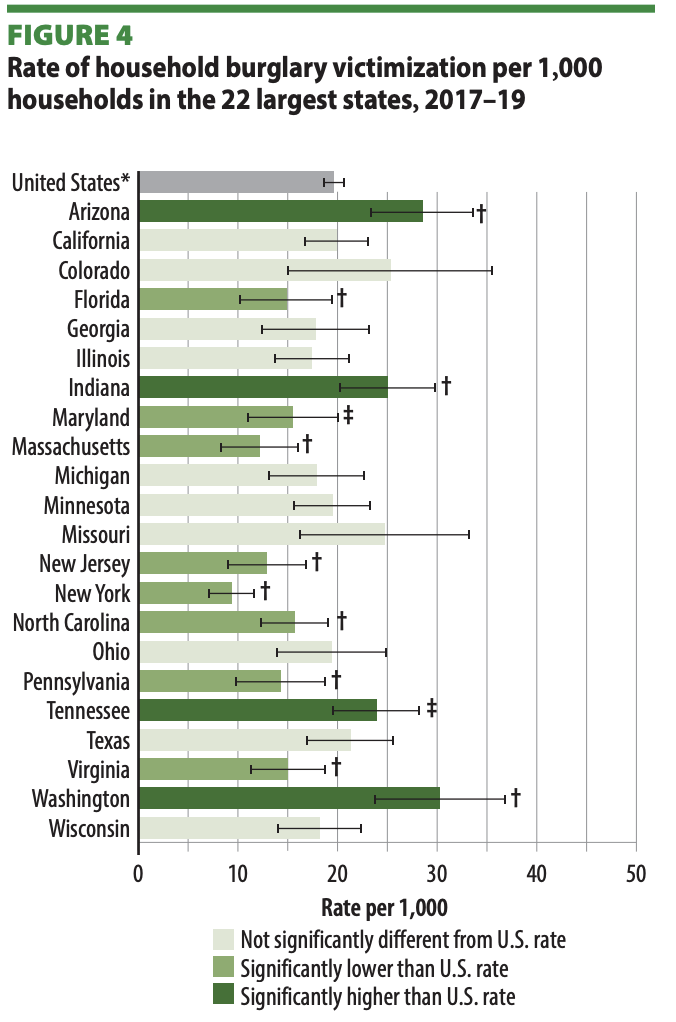
Arizona, Indiana, Tennessee, and Washington have much higher rates of burglary when compared to other large states.
Author
What This Article Does:
- Provides an overview of findings from the Bureau of Justice Statistics (BJS) as to states having the highest rates for violent crimes, property crimes, and burglaries for large states measured.
- Explains the Bureau of Justice Statistics National Crime Victimization Survey.
- Clarifies that the Bureau of Justice Statistics has been investigating how to take national findings on crime and apply them to states and possibly cities, counties, and metropolitan areas. BJS uses the term”subnational” to describe these attempts.
Article
This article is based on a new study by the Bureau of Justice Statistics (BJS) of the US Department of Justice and my opinion as to what that research may hold for future compilations of state crime data. I asked a variety of questions via email about the future of BJS subnational reports but after multiple days, I did not get a response.
The title of the new study from BJS is, “Criminal Victimization in the 22 Largest U.S. States, 2017–2019.”
It would be simpler to just offer the report’s findings as to states having high rates for violence and property crimes (see “22 State To State Comparisons” below) but there are important policy and research considerations for justice administrators to consider (i.e., what happens when your numbers or rates of crime double or triple?).
Because the National Crime Victimization Survey is relatively unknown to many, some explanation is prudent.
The National Crime Victimization Survey-Background
The Bureau of Justice Statistics National Crime Victimization Survey (NCVS) is designed to capture all crimes in the United States (excluding homicides-you can’t interview dead people), not just crimes reported to law enforcement offered by the FBI.
Only 43 percent of violent crimes were reported to law enforcement during the period of this research. The NCVS started in 1973. BJS offers yearly national crime data through its “Criminal Victimization” series.
BJS (and the National Institute of Justice-NIJ) took NCVS data (along with crimes reported to law enforcement via NIJ) and compiled it by cities, counties, and metropolitan areas several years ago (see the bottom of the link). The new report has a summation of previous research.
There is obviously federal interest in a more robust understanding of subnational crime numbers and rates as it applies to state and local jurisdictions. The purpose is to provide a more nuanced set of data and a better understanding of crime at the local level. The FBI is currently doing something similar with its National Incident-Based Reporting System.
The National Crime Victimization Survey is considered a far more accurate method of articulating all crime in the United States. If a small percentage of violent and property crimes are reported to law enforcement, the survey “could” offer considerably higher numbers (not just rates).
The NCVS offers variables that are useful, such as rates of victimization, who’s victimized, places victimization occurs, injuries, victim services, and many other important variables.
It uses action-oriented questions rather than asking if you were the victim of an assault; it inquires if anyone hit you with a weapon or attempted to hit you with a weapon or object. It emulates methods used by the US Census.
Most citizens, reporters, and criminal justice practitioners have little knowledge of the National Crime Victimization Survey which is discouraging because it contains a potent understanding of discrete variables of crime.
I would guess that 90 percent of the conversations about violent and property crimes address incidents reported to law enforcement, not the NCVS. The FBI offers reported crime data nationally by city, state, and region each year.
22 Largest States Examined Representing 79% Of The U.S. Person Population And 75% Of Violent Crimes.
The new report is the Bureau of Justice Statistics’ (BJS) first release of “state” subnational (nonfatal) violent and property victimization data collected directly through the National Crime Victimization Survey. To produce direct subnational victimization statistics, BJS redesigned the NCVS sample in 2016 to accommodate precise estimates with data aggregated over a minimum of 3 years.
This report presents selected state-level estimates of violent and property victimization for the 3-year aggregate period of 2017–2019 in the 22 largest U.S. states: Arizona, California, Colorado, Florida, Georgia, Illinois, Indiana, Maryland, Massachusetts, Michigan, Minnesota, Missouri, New Jersey, New York, North Carolina, Ohio, Pennsylvania, Tennessee, Texas, Virginia, Washington, and Wisconsin.
Aggregating 3 years of state-level National Crime Victimization Survey victimization estimates increases the reliability and stability of these estimates in each state.
The 22 largest states included in this report accounted for a majority of both the U.S. person population and violent victimizations; during the 3-year aggregate period of 2017-2019, they represented 79% of the U.S. person population and 75% of violent crimes.
The Data Is Accurate
If you are a criminal justice administrator or a reporter, when the National Crime Victimization Survey starts releasing yearly rates based on states (or additional smaller jurisdictions), it’s going to be very interesting.
If BJS offers state data yearly, it’s possible that they could also offer “numbers” along with “rates” for counties or metropolitan areas as they have in preliminary studies. You need numbers to get rates so media or researchers could request numerical data if it’s not offered by BJS.
National Crime Victimization Survey yearly data includes large numbers of people surveyed. Independent researchers have validated their national and subnational data methodologies (see the report’s methodology). Add the fact that they present three years of data, their findings have relevance. Researchers use the data collected and extrapolate to the nation and now, to states and possibly smaller jurisdictions.
Three years of carefully designed methods using large numbers of people surveyed and a history of doing this since 1973 means that the data presented has a high probability of being accurate both for the 2017-2019 period, and today. Reports released many years ago by BJS are still being used because of the quality of their research and the large sample sizes.
Crime Rates And Totals For Your State Are Going To Be Much Higher
When (or if) yearly numbers are offered along with rates, the crime totals and rates for your state (or smaller jurisdiction) are going to be much higher than what’s offered via crimes reported to law enforcement.
It’s more than possible that your state’s numbers or rates of violent crimes could double or that property crimes could triple.
It’s possible that the Bureau of Justice Statistics could offer rates and numbers for smaller jurisdictions (metropolitan areas, counties, or cities) “if” they have sufficient participants to allow for extrapolation (the ability to take samples and make judgments about smaller jurisdictions). The smaller the population, the more difficult extrapolation becomes.
About 2 in 5 violent victimizations (43%) were reported to police nationwide during 2017–2019. The share of property victimizations reported to police across the 22 largest states ranged from 28% in Maryland and New York to 44% in North Carolina.
States are going to be compared to one another as to rates and numbers of crimes and the percentage of crimes reported.
As with the FBI’s crimes reported to law enforcement (and a warning within the body of the new BJS report), you will be cautioned against using the data for comparison purposes which every media source in the country will promptly ignore.
22 State To State Comparisons
Per figure one, Arizona, Colorado, and Washington states have much higher rates of violence than comparison states. Colorado (45.0 violent victimizations per 1,000 persons age 12 or older), Arizona (36.8 per 1,000), and Washington (36.8 per 1,000) had higher violent crime rates than the nation (21.6 per 1,000) during the 3-year period of 2017–2019.
If you exclude simple assaults and measure more serious violence, Arizona, Colorado, and Washington continue to lead all other states.
For figure two, Arizona, Colorado, California, Indiana, Texas, and Washington have much higher rates of property crimes. Higher rates were reported in Washington (202.5 per 1,000), Colorado (161.3 per 1,000), Arizona (151.5 per 1,000), California (145.9 per 1,000), Indiana (121.1 per 1,000), and Texas (117.3 per 1,000). During 2017–19, the overall property crime rate in the United States was 105.9 victimizations per 1,000 households
For figure four, Arizona, Indiana, Tennessee, and Washington have much higher rates of burglary. They had higher rates than the national rate of 19.7 household burglaries per 1,000 households: Washington (30.3 per 1,000), Arizona (28.5 per 1,000), Indiana (25.0 per 1,000), and Tennessee (23.9 per 1,000).
State Comparison Charts

When Will Current BJS Data For States Be Released?
Is the Bureau of Justice Statistics going to routinely offer updated subnational data for current years? Will data for smaller jurisdictions be included? I don’t know. I asked but they never responded. But their preliminary studies set the stage for this becoming a reality.
Via the charts above, there’s considerable variation from state to state which is both expected and interesting.
My assumption is that the same data offered by the Bureau of Justice Statistics in their yearly “Criminal Victimization” series of national reports will apply to states, thus we “could” know of a wide array of variables as to victimization numbers and rates, who’s victimized, injuries, victim services, and many other considerations in each state. Note that for some variables, what BJS offers differs from year to year.
Conclusions
We may be on the cusp of new yearly data that will offer unique insights into state crime rates and totals and many additional variables. Will all states be included and not just the largest? I don’t know. BJS never responded to my questions.
The detail offered in national reports from the Bureau of Justice Statistics National Crime Victimization Survey provides a potent set of details that gives us a much better understanding of violent and property crimes. As stated above, the FBI is attempting to offer similar-improved qualitative data through its emerging National Incident-Based Reporting System.
Criminality is vastly complex and new efforts by the FBI and the Bureau of Justice Statistics (yes, they interact and strengthen each other’s efforts) may offer the country detailed and truly useful rates and numbers along with examinations of discrete variables (i.e., who is victimized-who are the offenders-where crime happens-many other variables).
Now the question is when the Bureau of Justice Statistics will offer current (the latest full national report is for 2021) data broken down by state. However, “Criminal Victimization in the 22 Largest U.S. States” is only two years behind the most recent data. There is a high probability that the findings accurately apply to the states measured now.
When additional subnational data happens (and if it includes county-metropolitan areas or cities) it will provide a wide array of insights plus questions as to why rates or numbers are so much higher in some jurisdictions when compared to others.
Why do Arizona, Colorado, and Washington have much higher rates of violence and serious violence? Why are property crimes reported only at 28% for Maryland and New York when they are much higher (44%) in North Carolina? Why do some states have double or triple the rates than the national average?
I assume these states are asking themselves the same questions. I presume that it’s principally based on crime problems within their major cities (violence is up considerably in urban areas). Most of the “safer” states (based on media ratings) are mostly rural with some significant exceptions (i.e., Alaska).
Context: Why Crimes Are Not Reported
Crimes are not reported for an endless number of reasons. Via the Bureau of Justice Statistics, most violence happens between people who know each other. An aggravated assault may be considered a private matter but when the National Crime Victimization Survey contacts you, they are not interested in who committed the assault, thus the victim acknowledges that his friend hit him with a beer bottle during a drunken dispute but the incident was not reported to police. There are endless additional reasons for not reporting crimes.
Some within the justice system believe that crimes reported to law enforcement are “serious” enough to contact the police. Some speculate that crimes articulated by the National Crime Victimization Survey happen but for a wide variety of reasons (i.e., fear of retribution-violence among friends) they are not reported.
There are endless numbers of property crimes (and frauds) where the victim believes that law enforcement can do little to resolve the situation, thus they are not reported. The overwhelming number of frauds are not reported to law enforcement per BJS.
Privacy Policy
We do not collect your personal information. See our privacy policy at “About This Site.”
See More
See more articles on crime and justice at Crime in America.
Most Dangerous Cities/States/Countries at Most Dangerous Cities.
US Crime Rates at Nationwide Crime Rates.
National Offender Recidivism Rates at Offender Recidivism.
The Crime in America.Net RSS feed (https://crimeinamerica.net/?feed=rss2) provides subscribers with a means to stay informed about the latest news, publications, and other announcements from the site.
One Reply to “States Having The Highest Rates Of Violent And Property Crimes”