

Highlights
An overview of states based on rates of violent offenses and rates of violent victimizations, using crimes reported to law enforcement, as articulated by the FBI.
Most crimes are not reported to police agencies, according to the Bureau of Justice Statistics.
CrimeinAmerica.Net-Chat GPT’s “Top 10 Sources for Crime in America” based on primary statistical sources with trusted secondary analysis.
100 out of a possible 100 score based on website trust, content, and links, Gridinsoft.com.
Quoted by The Associated Press (multiple times), USA Today, A&E Television, the nationally syndicated Armstrong Williams Television Show (30 times), ABC News, Inside Edition Television, Oxygen and allied publications, Vox, Forbes, Newsweek, The Economist, The Toronto Sun, The Chicago Tribune, The Daily Beast, The Huffington Post, The Baltimore Sun, The Boston Herald, The Capital Gazette, MSN, AOL (multiple times), Yahoo, JAMA, News Break, US News And World Report, The Hill (newspaper of Congress), Department of Justice documents, multiple US Supreme Court briefs, C-SPAN, the National Institutes of Health, college and university online libraries, multiple books and journal articles, The National Institute of Corrections, The California Department of Justice,The Office of Juvenile Justice And Delinquency Prevention, The Bureau of Justice Assistance, Gartner Consulting, The Maryland Crime Victims Resource Center, Law.Com, The Marshall Project, The Heritage Foundation via Congressional testimony, Law Enforcement Today, Law Officer.Com, Blue Magazine, Citizens Behind The Badge, Police 1, American Peace Officer, Corrections.Com, Prison Legal News , The Journal of Offender Monitoring, Yomiuri Shimbun (Asia’s largest newspaper), Le Figaro (France’s oldest newspaper), Homeland Security Digital Library, The ABA Journal, The Daily Express (UK) The Harvard Political Review, The Millennial Source, The Federalist Society, Lifewire, The Beccaria Portal On Crime (Europe), The European Journal of Criminology, American Focus and many additional TV stations and publications.
Sign up for notice of new articles on the front page of this site.
A comprehensive overview of crime for recent years is available at Violent and Property Crime Rates In The U.S.
Article
In a document from the Bureau of Justice Statistics of the US Department of Justice titled, Crime Known to Law Enforcement, 2024:
Findings in this report, the second in an annual series, are based on the Bureau of Justice Statistics’ (BJS) and FBI’s National Incident-Based Reporting System (NIBRS) Estimation Program. NIBRS collects detailed information on crime incidents reported to law enforcement in the United States. Estimates in this report are based on NIBRS data from state, local, tribal, and university agencies.
Readers may be confused with the Bureau of Justice Statistics’ National Crime Victimization Survey, which counts reported and unreported violent and property crime. This article is based on FBI-reported crimes; most crimes are not reported to law enforcement.
Previous Report
This is a follow-up to a previously released report, USDOJ-States With The Highest Rates For Violent And Property Crimes
Important Distinctions
Both the Federal Bureau of Investigation and the Bureau of Justice Statistics rely on crimes reported by local police departments, but they analyze the data differently. The FBI generally reports the totals submitted directly by police agencies.
The BJS report, Crime Known to Law Enforcement, 2024, uses incident-level data and counts all crimes that occur during a single event, not just the most serious offense offered in the FBI annual reports.
BJS also uses statistical methods to estimate crimes from agencies that did not fully report data. Because of these differences, the two reports can show slightly different national crime trends even though they rely on the same basic police data.
This report refers to rates of violent offenses and rates of violent victimizations. The rate of violent offenses counts the number of violent crimes recorded by police. The rate of violent victimization counts people who were victims of those crimes in police reports.
Five states were not included because estimates did not meet statistical reliability criteria: Alaska, Arizona, Hawaii, Mississippi, and Pennsylvania. See the report methodology
Highlights
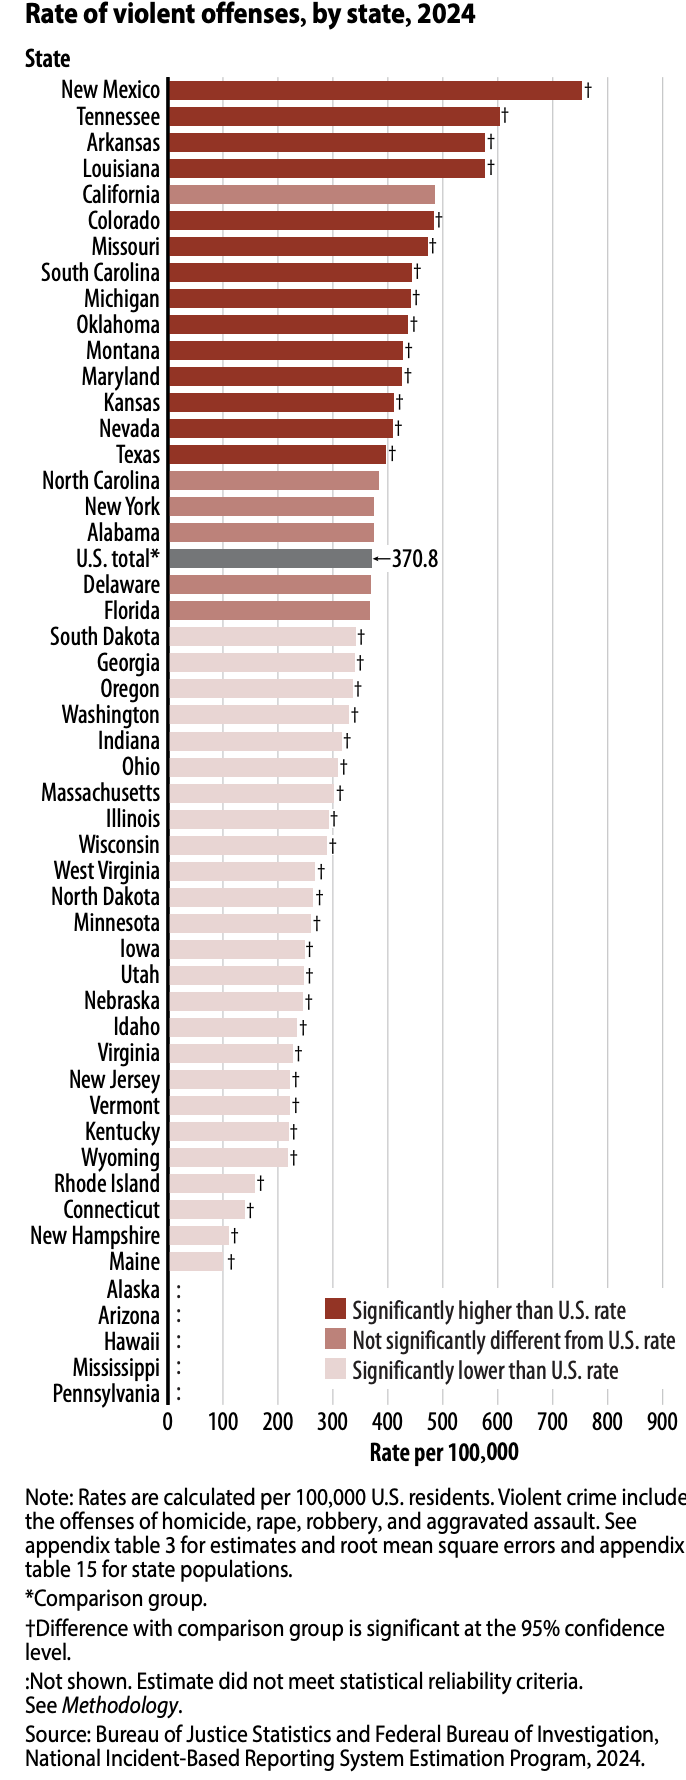
The rate of violent offenses in the United States decreased from 393.9 per 100,000 persons in 2023 to 370.8 per 100,000 in 2024.
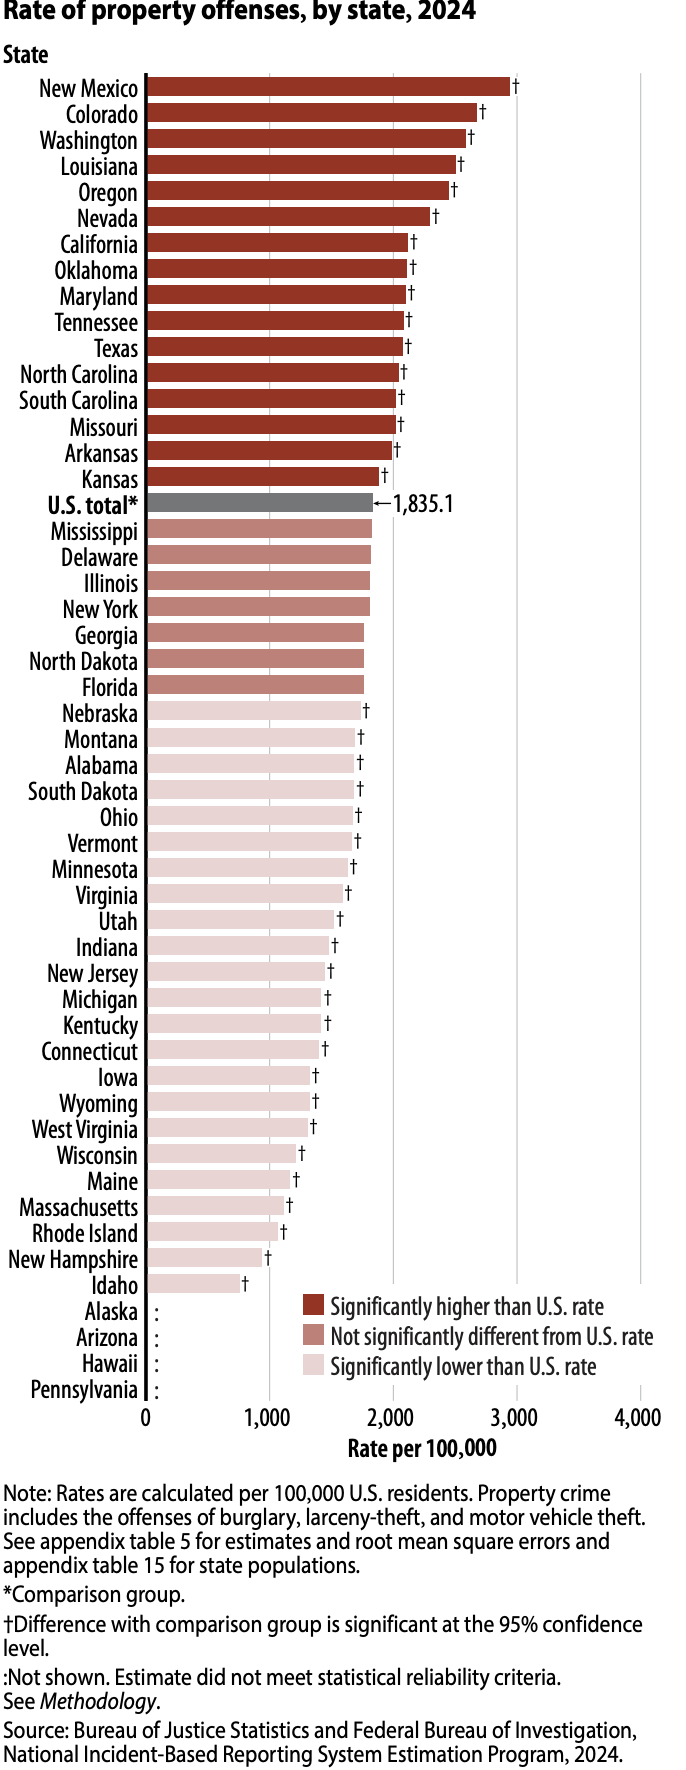
The rate of property offenses decreased 9% from 2,019.7 per 100,000 persons in 2023 to 1,835.1 per 100,000 in 2024.
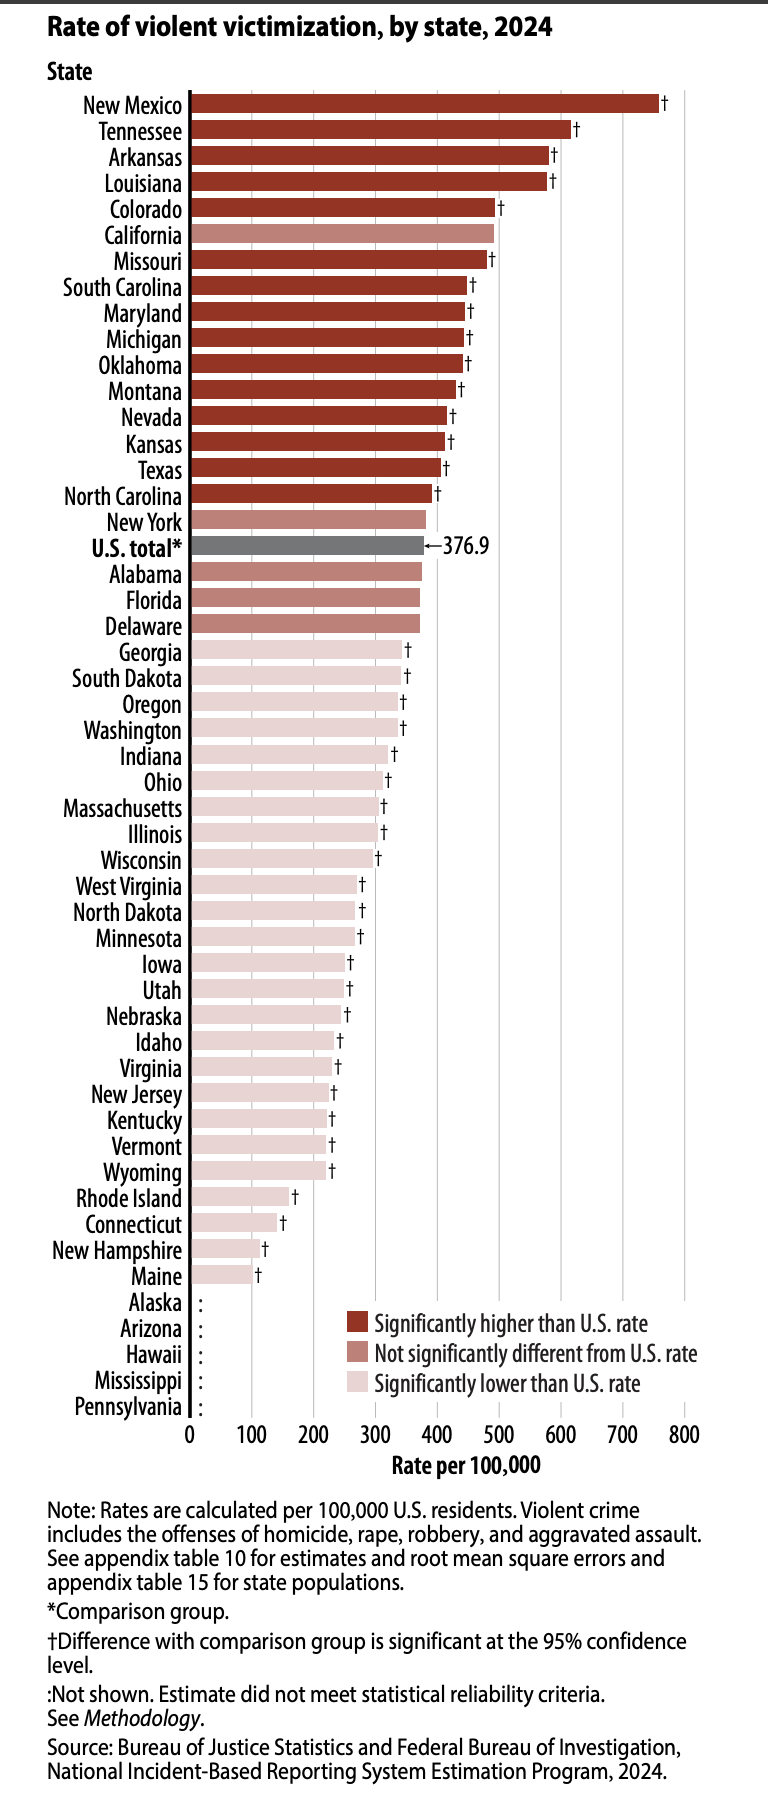
The rate of violent victimization in 2024 was 376.9 per 100,000 persons, down from the 2023 rate of 401.1 per 100,000.
Males and females both had decreases in the rate of homicide victimization from 2023 to 2024.
The victimization rates for burglary and larceny-theft both decreased from 2023 to 2024.
From 2023 to 2024, the overall violent victimization rate declined for persons who were white, black, or Asian.
During the same period, Hispanic, American Indian or Alaska Native, and Native Hawaiian or Other Pacific Islander persons did not experience statistically significant changes in their overall violent crime victimization rate.
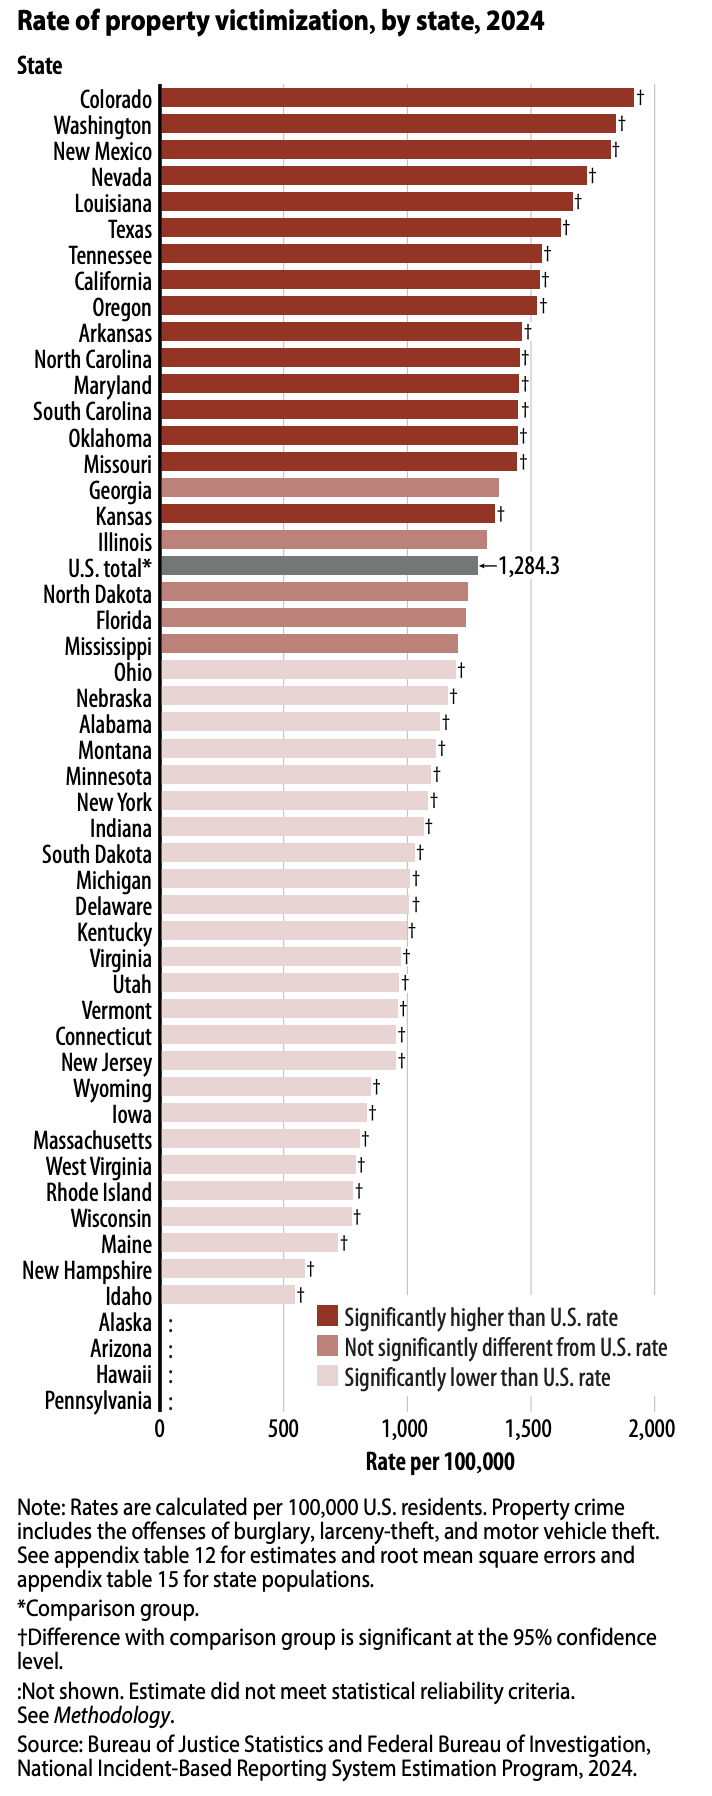
From 2023 to 2024, the rate of property victimization decreased 12% from 1,467.4 per 100,000 persons to 1,284.3 per 100,000.
The motor vehicle theft victimization rate decreased 18% from 306.4 per 100,000 persons in 2023 to 250.5 per 100,000 in 2024.
Rate of Violent Offenses-2024-States Above the US Total
New Mexico
Tennessee
Arkansas
Louisiana
California
Colorado
Missouri
South Carolina
Michigan
Oklahoma
Montana
Maryland
Kansas
Nevada
Texas
North Carolina
New York
Alabama
ChatGPT
ChatGPT offered data and fact-checked this article.
Privacy Policy
We do not collect your personal information. See our privacy policy at “About This Site.”
See More
See more articles on crime and justice at Crime in America.
Most Dangerous Cities/States/Countries at Most Dangerous Cities.
US Crime Rates at Nationwide Crime Rates.
National Offender Recidivism Rates at Offender Recidivism.
The Crime in America.Net RSS feed (https://crimeinamerica.net/?feed=rss2) provides subscribers with a means to stay informed about the latest news, publications, and other announcements from the site.