We are at a new level of criminal violence in the United States.
This article is available as a podcast on YouTube.
Per the USDOJ’s updated National Crime Victimization Survey, record rates of violent crime continue.
Urban violent crime increased.
The great majority of what we call crime is not reported to law enforcement.
Rates increased from 2020 to 2024 for intimate partner violence, violent victimization by a stranger, and violent victimization with a weapon.
The rate of violent victimization excluding simple assault increased for persons ages 50 to 64, and doubled for persons in households earning $200,000 or more.
CrimeinAmerica.Net-Chat GPT’s “Top 10 Sources for Crime in America”based on primary statistical sources with trusted secondary analysis.
Author
Leonard Adam Sipes, Jr.
Former Senior Specialist for Crime Prevention and Statistics for the Department of Justice’s clearinghouse. Former Director of Information Services, National Crime Prevention Council. Former Adjunct Associate Professor of Criminology and Public Affairs-University of Maryland, University College. Former police officer. Retired federal senior spokesperson.
Former advisor to presidential and gubernatorial campaigns. Former advisor to the “McGruff-Take a Bite Out of Crime” national media campaign. Produced successful state anti-crime media campaigns.
Thirty-five years of directing award-winning (50+) public relations for national and state criminal justice agencies. Interviewed thousands of times by every national news outlet, often with a focus on crime statistics and research. Created the first state and federal podcasting series. Produced a unique and emulated style of government proactive public relations.
Certificate of Advanced Study-The Johns Hopkins University.
Author of ”Success With The Media: Everything You Need To Survive Reporters and Your Organization,” available at Amazon and additional bookstores.
Crime in America.Net-“Trusted Crime Data, Made Clear.”
Quoted by The Associated Press, USA Today, A&E Television, the nationally syndicated Armstrong Williams Television Show (30 times), Department of Justice documents, US Supreme Court briefs, C-SPAN, the National Institute of Health, college and university online libraries, multiple books and journal articles, The Baltimore Sun, The Capital Gazette, MSN, The Huffington Post, JAMA, The National Institute of Corrections, The Office of Juvenile Justice And Delinquency Prevention, The Bureau of Justice Assistance, Gartner Consulting, The Maryland Crime Victims Resource Center, Law.Com, The Marshall Project, The Heritage Foundation via Congressional testimony, Law Enforcement Today, Law Officer.Com, Blue Magazine, Corections.Com, Prison Legal News, The Hill (newspaper of Congress), the Journal of Offender Monitoring, Inside Edition Television, Yomiuri Shimbun (Asia’s largest newspaper), LeFigaro (France’s oldest newspaper), Oxygen and allied publications, Forbes, Newsweek, The Economist, The Toronto Sun, Homeland Security Digital Library, The ABA Journal, The Daily Express (UK) The Harvard Political Review, The Millennial Source, The Federalist Society, Lifewire, The Beccaria Portal On Crime (Europe), The European Journal of Criminology, American Focus and many additional publications.
Sign up for notice of new articles on the front page of this site.
There is a significant difference between reported crime, as offered by the FBI (the great majority of crime is not reported to law enforcement), and totalcrime as collected by the updated USDOJ National Crime Victimization Survey.
Note
I encourage readers to access the document and check the footnotes of charts for statistical significance (statistical significance means that the change we’re seeing in the data is big enough that it’s unlikely to be just due to chance).
Article
I remember when the rates of violence increased substantially when reading the National Crime Victimization Survey for 2022. They went from 16.5 per 1,000 people to 23.5 per 1,000 people. As someone who followed the NCVS for decades, this was one of the largest increases in violence in our nation’s history. It was a shocking increase.
For most years, increases or decreases in the survey were rather small. Consistency was a hallmark, with some exceptions like the 28 percent increase in rates of violence for 2015-2018.
The 2022 NCVS was the largest increase in violent crime in the nation’s history (44 percent), as recorded by analyst Jeff Asher, The Marshall Project, and ChatGPT.
Per the press release (September 12, 2024) from the US Department of Justice for the new 2023 report, “Data from the National Crime Victimization Survey (NCVS) indicate that in 2023, the rate of nonfatal violent victimization in the United States was 22.5 victimizations per 1,000 persons age 12 or older, which was similar to the 2022 rate of 23.5 violent victimizations per 1,000 persons age 12 or older.”
The new NCVS survey for 2024 states that rates of violent crime remain unchanged.
Thus, very high rates of violence continue for 2022, 2023, and 2024.
Urban violent crime increased in 2024 from 29.6 to 34.0 per 1,000. “Urban” means a central city of 50,000+ within a metro area.
So the huge increase in rates of violent crime continues when most crime observers were convinced that it would decline based on the 44 percent increase in 2022. We believed that the 2022 increase could not continue. Yet violent crime rates for 2023 and the new report for 2024 remain essentially unchanged.
We are at a new level of criminal violence in the United States.
The NCVS Is Over 50 Years Old
The report below is from the Bureau of Justice Statistics of the US Department of Justice. It’s based on the National Crime Victimization Survey (NCVS).
It’s a 50-year-plus survey that started in 1973. At the time, we understood that the vast majority of criminality went unreported through crimes not reported to law enforcement. The discussion was that we within the law enforcement and criminological community would never understand the true nature of crime without it.
I was the senior specialist for crime prevention and statistics at the Department of Justice’s clearinghouse, and I spent a considerable amount of time with specialists from the Bureau of Justice Statistics, asking questions about the NCVS and the best methods for explaining the survey to the media and members of the justice system. I was concerned that the surveys contained a wealth of information that was not being used.
As of this writing, days after the release of the new NCVS, the media continues to ignore the report. Could you imagine the media disregarding federal statistics on diseases, jobs, or the overall economy? That would be considered malfinance, yet journalists continue to ignore information vital to our understanding of crime.
The US Census Bureau describes the NCVS as the nation’s premier count of criminal victimization in the United States.
The media and the public seem to put great faith in crimes reported to law enforcement through the FBI, even though the great majority of crime is not reported to the police. Recent yearly FBI data indicate reductions in violence of 3-4 percent.
Many criminologists consider a sole dependence on reported crimes to be a flawed strategy that provides a misleading or inaccurate picture of crime.
As an example, approximately 80 percent of what we call crime are property events, and only 30 percent of those are reported to the police.
What’s The Numerical Difference Between The FBI and the NCVS Crime Counts?
Approximately 20 million crimes were recorded by the National Crime Victimization Survey, compared to approximately 14 million crimes reported to law enforcement, as compiled by the FBI. Approximately 24 million additional identity thefts were identified by the Bureau of Justice Statistics, while the FBI’s IC3 received 21,403 complaints related specifically to identity theft.
Why Don’t Victims Report Crime?
Most violent crimes are committed by someone we know, even if it’s just as an acquatance. In many of these cases, it’s seen as a private or personal matter. As to property crimes, victims often doubt that law enforcement can find the offender, so they don’t report the event.
Chart-(click to enlarge)
We need to understand that there are endless reasons for not reporting crimes. But that doesn’t mean that non-reporting victims didn’t suffer physical or psychological harm or that the stolen items were insignificant.
There is a booming industry in personal or home security services that is reaping huge profits from people’s victimization. Firearm sales have increased dramatically to the point where some estimates suggest that there are approximately 400 million firearms in private hands.
Readers need to understand that just because a crime is not reported doesn’t mean that victims are not traumatized or are not spending significant sums to protect themselves.
As a police officer, I encountered people who moved because of property crimes or area criminality. There is a survey suggesting that crime is a major reason for people moving.
How Many Crimes Are Reported? 13 Percent Of Urban Sex Assaults Are Reported
Crimes reported to law enforcement will change from year to year. A very recent report based on three years of NCVS data stated:
About 38% of violent victimizations in urban areas were reported to police, which was lower than the percentages in suburban (43%) and rural (51%) areas, per the Bureau of Justice Statistics of the USDOJ.
The percentage of rape and sexual assault victimizations in rural areas that were reported to police (52%) was almost four times higher than the share reported to police in urban areas (13%), and almost two times higher than the share reported in suburban areas (29%).
Reporting to police for simple assault victimizations was higher in suburban (39%) and rural areas (46%) than in urban areas (32%). Simple assaults likely comprised roughly 55–60 percent of total violent victimizations per ChatGPT.
For robbery, the percentage of victimizations reported to police was lower in suburban areas (49%) than urban areas (63%). The percentage of robbery victimizations reported to police was not statistically different between urban and rural areas.
A 44 Percent Increase-Rates Of Violent Crime Remain Consistent- Compared To Violent Decreases Of 3-4 Percent Through The FBI
There is a continuing discussion about crime and the fear of crime in the United States. Violent crimes reportedto law enforcement have decreased, especially in cities.
Per Gallup and other sources, we are near record increases in fear of crime.
The latest data from the FBI, based on crimes reported to the police, indicate that violent crime decreased by an estimated 4.5 percent in 2024. The FBI’s crime statistics estimates, based on reported data for 2023, show that national violent crime decreased an estimated 3.0 percent in 2023 compared to 2022.
Decreases of 4.5 and 3.0 percent are welcomed, but it’s not much to celebrate, especially when you consider that homicides increased by 50 percent and aggravated assaults increased by 36 percent from 2019 to 2022, per the Major Cities Chiefs Association.
City or Urban Violent Crime Increases
The current 2025 discussion is focusing on crime in cities based on significant decreases in reported violent crime since 2022. But the National Crime Victimization Survey states that urban crime increased from 29.6 per 1,000 in 2023 to 34.0 in 2024.
The Bureau of Justice Statistics, in the Department of Justice’s Office of Justice Programs, released Criminal Victimization on September 29, 2025. This report presents official estimates of nonfatal criminal victimization reported and not reported to police from BJS’s National Crime Victimization Survey (NCVS).
The report is the 52nd in a series that began in 1973 and includes statistics on nonfatal violent crimes (rape or sexual assault, robbery, aggravated assault, and simple assault) and property crimes (burglary or trespassing, motor vehicle theft, and other types of household theft). The report also describes characteristics of crimes and victims. It doesn’t include retail or corporate crime, but identity theft is covered in a separate report.
Murders are not included because you can’t interview dead people.
Violent Victimizations
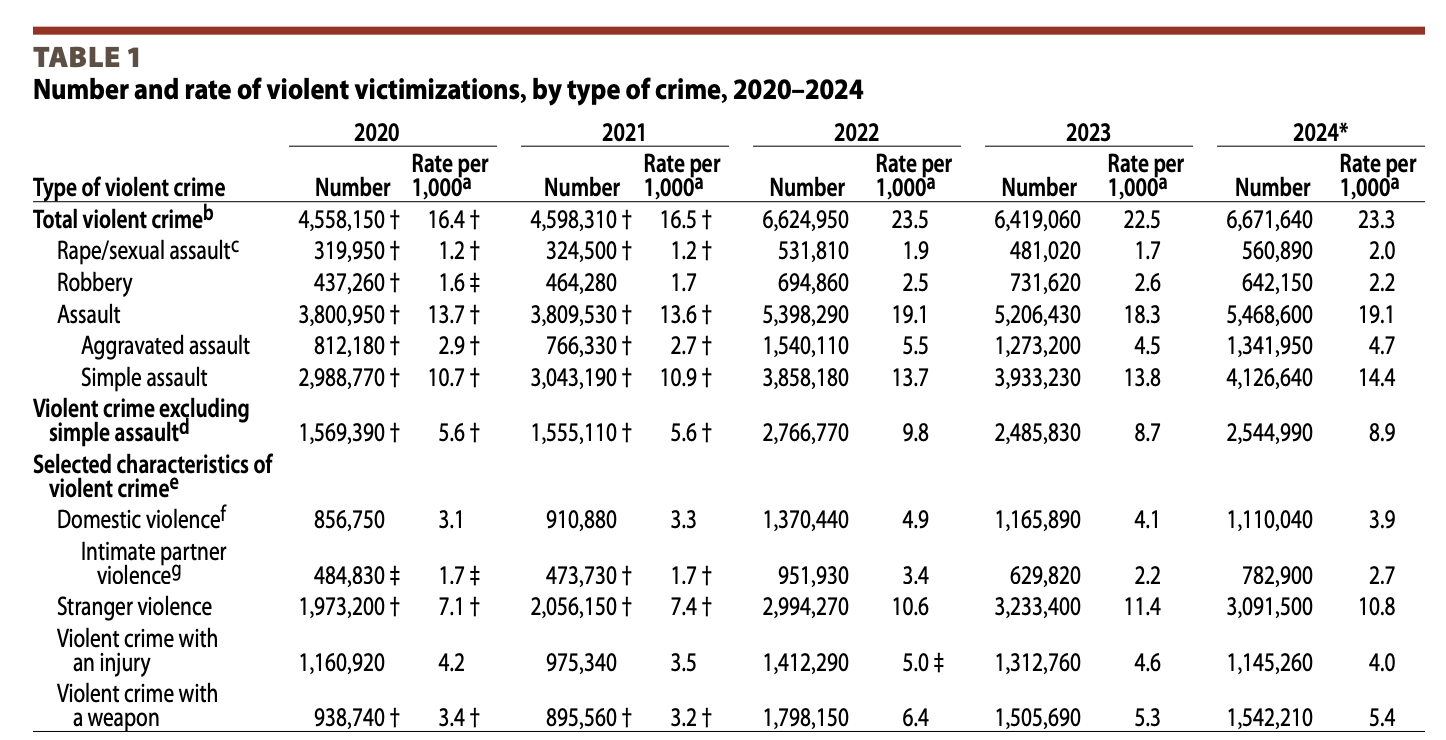
Victimizations reflect the total number of times that persons or households were victims of crime. There were 6.7 million violent victimizations of persons age 12 or older in the United States in 2024.
This was not significantly different from the number in 2023 but was larger than the number of violent victimizations 5 years before, in 2020 (4.6 million).
In 2024, the rate of violent victimization was 23.3 victimizations per 1,000 persons age 12 or older, which was not significantly different from the rate in 2023. There were also no significant changes from 2023 to 2024 in the rates of specific types of violent crime.
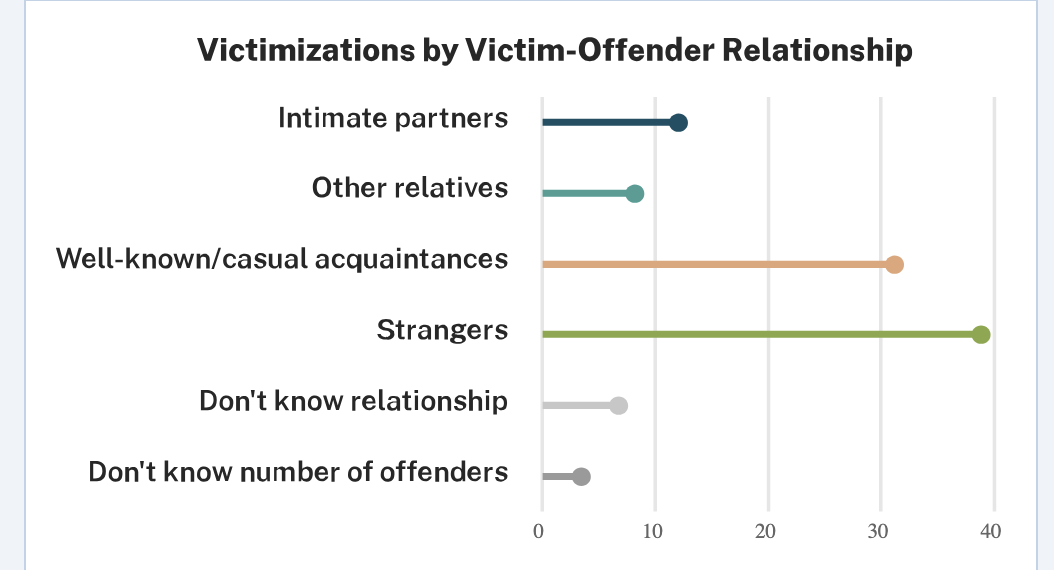
Rates increased from 2020 to 2024 for intimate partner violence (1.7 per 1,000 persons age 12 and older in 2020 to 2.7 per 1,000 in 2024), violent victimization by a stranger (7.1 to 10.8 per 1,000) and violent victimization with a weapon (3.4 to 5.4 per 1,000).
Chart (click to enlarge)
Violent Victimizations-2024
Property Victimizations
There were 13.1 million property victimizations in 2024, similar to 2023. Households in the United States experienced 13.1 million property victimizations in 2024, which was comparable to the number in 2023 but larger than the number 5 years before, in 2020 (12.1 million). Property crime includes burglary or trespassing, motor vehicle theft, and other types of household theft.
The rate of property victimization remained stable from 2023 to 2024 (97.6 victimizations per 1,000 households) and was also similar to the rate in 2022. There were no significant changes in the rates of specific types of property victimizations between 2023 and 2024.
The motor vehicle theft rate increased from 4.3 per 1,000 in 2020 to 6.3 per 1,000 in 2024.
Violent Crime Increased For Older Individuals And Doubled For Higher Income Households
The rate of violent victimization excluding simple assault (what BJS called serious violent crimes in the past), increased for persons ages 50 to 64 in 2024.
From 2023 to 2024, the violent victimization rate increased for persons ages 35 to 49 (21.2 to 27.1 per 1,000 persons) and for persons in households earning $200,000 or more (15.7 to 22.1 per 1,000).
The rate of violent victimization by sex, race or Hispanic origin, or marital status did not change significantly from 2023 to 2024.
The rate of violent victimization excluding simple assault increased from 2023 to 2024 for persons ages 50 to 64 (6.2 to 9.1 per 1,000 persons) and persons in households earning $200,000 or more (4.0 to 8.0 per 1,000).
During the same period, the rate decreased in households earning $25,000 to $49,999, from 10.2 per 1,000 persons to 6.5 per 1,000
Reporting Crime To Police-Big Yearly Increases For Some Crimes
Approximately 48% of violent victimizations were reported to police in 2024, which was not significantly different from the percentage in 2023.
The percentage of rape or sexual assault victimizations reported to police decreased significantly, from 46% in 2023 to 24% in 2024.
A greater percentage of robbery victimizations were reported to police in 2024 (73%) than in 2023 (42%).
In addition, the percentage of aggravated assaults, violent crimes excluding simple assault, domestic violence victimizations, and violent crimes with a weapon that were reported to police all increased from 2023 to 2024.
In 2024, 30% of property victimizations were reported to police. This percentage did not vary from 2023, and there were no significant differences between 2023 and 2024 in the percentages of specific types of property victimizations reported.
Approximately 75% of Firearm Victimizations Were Reported To Police In 2024-10 Percent Involved Firearms
Of the approximately 6.7 million violent victimizations in 2024, about 660,000 (10%) involved a firearm, which was not significantly different from the number in 2023. Firearm victimizations are violent victimizations where the offender possessed, showed, or used a firearm.
About 75% of firearm victimizations were reported to police in 2024, consistent with 2023.
Demographics-Offenders And Victims
Patterns varied in the demographic characteristics of victims and offenders (as perceived by victims) involved in violent incidents. In 2024, the share of violent incidents involving male and female victims was similar to the share of males and females in the U.S. population.
The percentage of violent incidents involving male offenders (76%) was 1.5 times the percentage of males in the population, and the percentage of violent incidents with female offenders (19%) was less than half of the percentage of females in the population.
In 2024, Asian persons or Native Hawaiian or Other Pacific Islander persons were victims (4%) or offenders (3%) in a smaller proportion of violent incidents than their representation in the population (7%).
The share of violent incidents involving white offenders (47%) was smaller than the share of white persons in the population (60%).
The proportion of violent incidents with black offenders (28%) was larger than the proportion of black persons in the population (12%).
The percentage of violent incidents involving victims ages 18 to 29 (27%) was larger than the age group’s share of the population (18%).
The shares of incidents where the victims (61%) or offenders (66%) were age 30 or older were smaller than this age group’s proportion of the population (73%).
Based on victims’ perceptions of offenders’ race or Hispanic origin, more violent incidents involving white victims were committed by white offenders (1,706,750 incidents) than by offenders who were black, of Hispanic origin, of some other race, or of an unknown race.
A greater number of incidents involving black victims were committed by black offenders (402,960) than by white offenders (57,370).
In addition to the prevalence of overall violent crime, the percentages of persons age 12 or older who were victims of rape or sexual assault, aggravated assault, simple assault, and violent crime excluding simple assault were larger in 2024 than 5 years before, in 2020.
Over this 5-year period, there were also increases in the prevalence of stranger violence (0.54% to 0.77%) and violent crime with a weapon (0.28% to 0.36%).
A total of 416,580 persons experienced one or more violent victimizations by an intimate partner in 2024, which was more than in 2023 (296,260).
Use of ChatGPT For Fact Checking
ChatGPT fact-checked this article and offered recommendations.
Privacy Policy
We do not collect your personal information. See our privacy policy at “About This Site.”
Findings are based on the National Crime Victimization Survey (NCVS), a self-report survey administered annually from January 1 to December 31. Annual NCVS estimates are based on the number and characteristics of crimes that respondents experienced during the prior 6 months, excluding the month in which they were interviewed. Therefore, the 2024 survey covers crimes experienced from July 1, 2023 to November 30, 2024, with March 15, 2024, as the middle of the reference period. Crimes are classified by the year of the survey and not by the year of the crime. To make reliable comparisons over time, this report examines only NCVS data collected since the survey’s 1993 redesign. Because the NCVS relies on self-reported survey data, estimates may not include victimizations not reported to NCVS interviewers.