

Per “Criminal Victimization” from the Bureau of Justice Statistics for 2015 and 2016 (The National Crime Survey), violent crimes went from 5 million violent victimizations to 5.7 million violent victimizations.
When examing the 2015 and 2016 rates from “Criminal Victimization,” the rate for violent crime was 18.7 in 2015 and the rate for 2016 was 19.5.
The Bureau of Justice Statistics, however, states that changes in methodology limit the use these findings; “…increases seemed too large to be a result of actual growth in crime…”
The growth in violent crime from “Criminal Victimization” (National Crime Survey) accompanies substantial increases in reported violent crime from the FBI (reported crimes) for 2015 and 2016.
See note from the Bureau of Justice Statistics at the bottom of this article–added after publication.
Author
Leonard Adam Sipes, Jr.
Thirty-five years of speaking for national and state criminal justice agencies. Interviewed multiple times by every national news outlet. Former Senior Specialist for Crime Prevention for the Department of Justice’s clearinghouse. Former Director of Information Services, National Crime Prevention Council. Post-Masters’ Certificate of Advanced Study-Johns Hopkins University.
New National Crime Survey Report
There is a new annual report from the Bureau of Justice Statistics of the US Department of Justice titled “Criminal Victimization” (referred to as the National Crime Survey) that is based on surveys of the American public. The National Crime Survey is designed to provide an overview of total crime in the US versus reported crimes as documented by the FBI.
National Crime Survey data will always discover more crime. For example, only 42 percent of violent crimes were reported in 2016.
An overview of the three measures of crime in the US (National Crime Survey, FBI, Gallup) is available at Crime in America.
Media (including this site) is having a difficult time interpreting this year’s version of the National Crime Survey because of a redesign in the methodology.
New Methodology
To produce estimates of criminal victimization, the Bureau of Justice Statistics’ (BJS) National Crime Victimization Survey (NCVS) collects information from a sample of U.S. households that represents the nation.
The sample design (or use of new counties) is periodically changed to maintain the representativeness of the survey.
In 2016, the National Crime Survey sample was redesigned for two reasons: 1. to reflect changes in the U.S. population based on the 2010 Census and 2. to make it possible to produce state and local-level victimization estimates for the largest 22 states and specific metropolitan areas within those states.
The Results for 2016
For Criminal Victimization, the Bureau of Justice Statistics says the following:
“The ability to compare 2016 estimates of crime to 2015 or other years was limited due to a redesign of the NCVS sample.
Does limited mean that we can’t use the data at all? There is growth as to crime rates.
Note that in another measure of crime, the FBI warns readers not to compare their reported crime rates (Crime in the US) from cities and states because of data and geographic limitations. That doesn’t stop anyone from using their data for comparison purposes or publishing the findings.
Finally, the Bureau of Justice Statistics states, “Among sampled areas that did not change (see chart below), there was no measurable difference in rates of violent or property crime from 2015 to 2016.”
I assume that “measurable” means statistically significant at the 95 percent confidence level. It doesn’t mean that the number of violent crimes did not go up. For an explanation of statistically significant, see Measuring U.
Chart Below
The chart below represents comparison numbers different than what was offered in Criminal Victimization of a rate of 21.1 victimizations per 1,000 persons. Per The Bureau of Justice Statistics, the “increases seemed too large to be a result of actual growth in crime, suggesting that the sample redesign may have affected the victimization rates.”
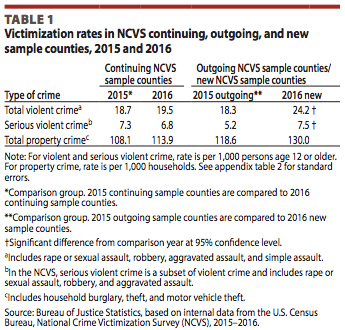
Per the Bureau of Justice Statistics, “To better understand these results, the 2015 and 2016 victimization rates for new and continuing sample counties were examined separately.”
When I look at the “examined separately” data below for new and continuing sample counties, it states that for 2015, the rate for violent crime was 18.7 and the rate for 2016 was 19.5 for the counties that remained the same. That shows growth in violent crime; it indicates that there is a measurable difference.
When new counties were added, total violent crime rates increased from 18.7 in 2015 to 24.2 in 2016.
Serious violent crime decreased except for a minor increase for the new counties added.
Property crime rated increased from 108.1 to 113.9 for the continuing counties and 130.0 for the new counties added.
See chart below.
How the Washington Post Interpreted the Numbers
The violent crimes measured in the survey comprise rape/sexual assault, robbery, aggravated assault and simple assault. From 2015 to 2016, the victimization rate per 1,000 people for those crimes rose slightly from 18.7 to 19.5, and the rate for serious violent crimes (i.e., excluding simple assault) dropped slightly from 7.3 to 6.8. Neither of these changes is statistically significant, suggesting that violent crime did not spike as feared in 2016, Washington Post.
How The Crime Report Interpreted the Numbers
As reported by crime victims, the national crime rate last year remained about the same as the 2015 total, the U.S. Justice Department’s National Crime Victimization Survey (NCVS) reported on Thursday.
In 2016, the survey said, residents aged 12 or older experienced 5.7 million violent victimizations, a rate of 21.1 per 1,000 persons.
The previous year, the same survey reported five million violent victimizations, a rate of 18.6 per 1,000 people.
However, the Bureau of Justice Statistics (BJS) which compiled the survey, said the new report did not establish a crime increase because the methodology changed during the year, The Crime Report.
How FiveThirtyEight Interpreted the Numbers
The 2016 survey found that there were about 21.1 violent crime victimizations per 1,000 persons age 12 or older. On its face, that would suggest a big rise in violent crime from the roughly 18.6 victimizations per 1,000 people identified in the 2015 NCVS. And the UCR released relatively similar findings in September, which appears to confirm that there was a rise in violent crime nationally in 2016.
The other reason to question whether NCVS points to a real rise in violent crime is that the survey changed how it constructs its sample of respondents, which means violent crime rates recorded in the 2016 survey are not comparable with findings from previous years. This was a “routine redesign” of the survey sample, which the NCVS performs every 10 years to keep up with the population changes identified since the most recent U.S. Census, FiveThirtyEight.
Conclusion
If you take a look at “Criminal Victimization” for 2015 and 2016 (not the chart offered above), violent crimes went from 5 million violent victimizations to 5.7 million violent victimizations. The Bureau of Justice Statistics states that new methodology skewed the results.
When examing the 2015 and 2016 victimization rates for new and continuing sample counties that were examined separately (chart above), the rate for violent crime was 18.7 in 2015 and the rate for 2016 was 19.5 for the counties that remained the same. That shows growth in violent crime; it indicates that there is a measurable difference. Other categories also showed growth.
The growth in violent crime from “Criminal Victimization” (National Crime Survey) accompany substantial increases in reported violent crime from the FBI (reported crimes) for 2015 and 2016.
Both the National Crime Survey and reported crime from the FBI accompany high rates of personal crime as documented by Gallup.
Note From the Bureau of Justice Statistics After This Article Was Published
Hi Len,
It’s incorrect to state that there was a growth in violent crime from 2015 to 2016 using NCVS data.
The sample went through a routine redesign which occurs every 10 years (this also happened in 2006). This redesign includes adding new households to the sample and new interviewers to interview these new households. There were so many changes to the sample that we determined (after extensive analysis some of which is outlined in the report) that the 2016 data (total data which includes continuing counties and new counties) could not be compared to the 2015 data.
Instead of just examining total counties (new and continuing counties), we also decided to examine just the continuing counties – counties that were in the sample in both 2015 and 2016 – to determine if the violent crime rate changed from 2015 to 2016.
We concluded after that analysis that there was no statistically significant change in the rates of violent crime in these continuing counties.
Source
Contact
Contact us at crimeinamerica@gmail.com.
Media on deadline, contact leonardsipes@gmail.com.
My book: “Amazon Hot New Release”- “A Must Have Book,” Success With The Media: Everything You Need To Survive Reporters and Your Organization available at Amazon
This is an ad-free website.
Reviews are appreciated.