

Highlights
This article is available as a YouTube podcast.
An overview of the states with the highest and lowest rates of violent and property crime in the United States.
The data was compiled by the Bureau of Justice Statistics of the US Department of Justice using crimes reported to law enforcement, with the understanding that the great majority of violent and property crimes are not reported to the police.
The article offers data on groups victimized by crime. In some cases, the differences are significant.
National crime statistical collection may change. Readers should peruse “A New Effort To Change The Collection Of Crime Statistics Will Impact Our Understanding Of Crime.” It’s at the bottom of this report.
CrimeinAmerica.Net-Chat GPT’s “Top 10 Sources for Crime in America” based on primary statistical sources with trusted secondary analysis.
Crime in America.Net-“Trusted Crime Data, Made Clear.”
Quoted by The Associated Press, USA Today, A&E Television, Inside Edition Television, Oxygen and allied publications, The nationally syndicated Armstrong Williams Television Show (30 times), Department of Justice documents, multiple US Supreme Court briefs, C-SPAN, the National Institute of Health, college and university online libraries, multiple books and journal articles, The Baltimore Sun, The Capital Gazette, MSN, AOL, Yahoo, The Daily Beast, The Huffington Post, JAMA, News Break, The National Institute of Corrections, The Office of Juvenile Justice And Delinquency Prevention, The Bureau of Justice Assistance, Gartner Consulting, The Maryland Crime Victims Resource Center, Law.Com, The Marshall Project, The Heritage Foundation via Congressional testimony, Law Enforcement Today, Law Officer.Com, Blue Magazine, Citizens Behind The Badge, Police 1, American Peace Officer, Corections.Com, Prison Legal News, The Hill (newspaper of Congress), the Journal of Offender Monitoring, , Yomiuri Shimbun (Asia’s largest newspaper), LeFigaro (France’s oldest newspaper), The Readers Digest (plus international editions), Money Geek, Forbes, Newsweek, The Economist, The Civic Research Institute, The Toronto Sun, Homeland Security Digital Library, The ABA Journal, The Cambridge University Press, The Daily Express (UK), The Harvard Political Review, The Millennial Source, The Federalist Society, Lifewire, The Beccaria Portal On Crime (Europe), The European Journal of Criminology, American Focus and many additional publications.
Sign up for notice of new articles on the front page of this site.
A comprehensive overview of crime for recent years is available at Violent and Property Crime Rates In The U.S.
Article
The Bureau of Justice Statistics of the US Department of Justice just released Crime Known to Law Enforcement, 2023. It contains crimes by state for violent and property violations.
The data is based on crimes reported to law enforcement, and readers of this site understand that the vast majority of what we call crime is not reported to the police.
Per a recent report from the Bureau of Justice Statistics, only 38 percent of violent crimes are reported to law enforcement in urban areas. For 2023, approximately 45 percent of violent victimizations were reported to police in the nation.
Approximately 80 percent of what we call crime are property events, and according to the Bureau of Justice Statistics, only 30 percent of property crimes are reported.
What’s Below
What’s below are charts from the Bureau of Justice Statistics focusing on rates of violent and property crimes per state.
New Mexico had the highest rates for violent and property crime.
Some state data was not included. The estimates did not meet statistical reliability criteria. See the report methodology.
Violent Crime
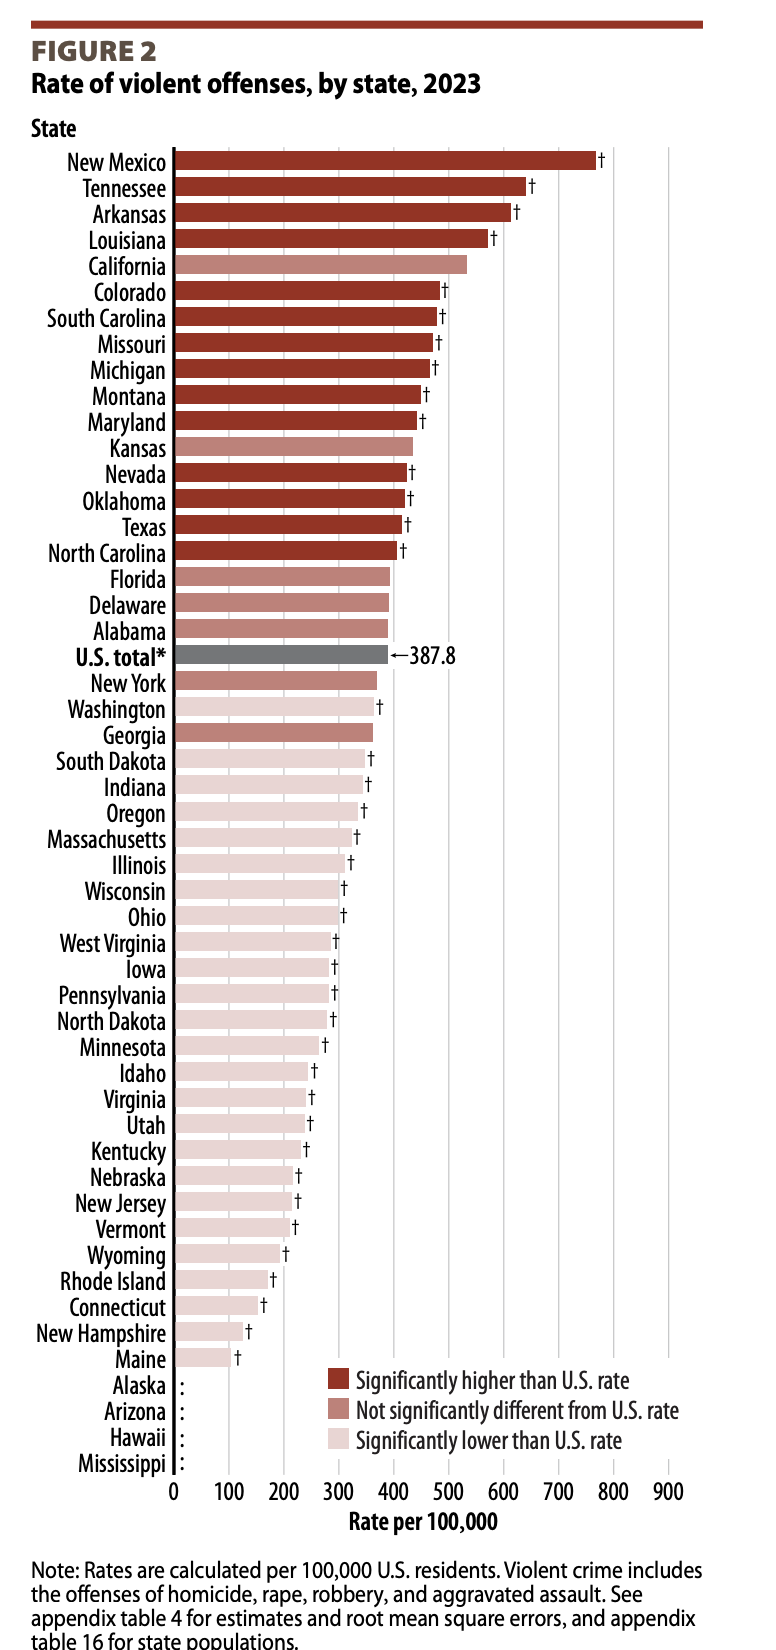
Fourteen states had a violent offense rate that was higher than the national rate.
The violent offense rate varied across states, from 766.7 violent offenses per 100,000 persons in New Mexico to 103.7 per 100,000 in Maine.
In total, 14 states had a violent offense rate that was higher than the national rate of 387.8 per 100,000.
The homicide offense rate ranged from 11.1 per 100,000 in New Mexico to 2.0 per 100,000 in Utah and Massachusetts.
A total of 12 states had a homicide offense rate that was higher than the national rate of 5.9 per 100,000.
The rape offense rate ranged from 71.1 per 100,000 in Arkansas to 18.7 per 100,000 in New Jersey.
A total of 21 states had a rape offense rate that was higher than the national rate of 40.1 per 100,000.
The robbery offense rate ranged from 131.2 per 100,000 in Maryland to 10.9 per 100,000 in Idaho.
A total of eight states had a robbery offense rate that was higher than the national rate of 68.7 per 100,000.
The aggravated assault offense rate ranged from 627.6 per 100,000 in New Mexico to 57.3 per 100,000 in Maine.
A total of 15 states had an aggravated assault offense rate that was higher than the national rate of 273.1 per 100,000.
Chart-Violent Crime Rates Per State
Property Crime
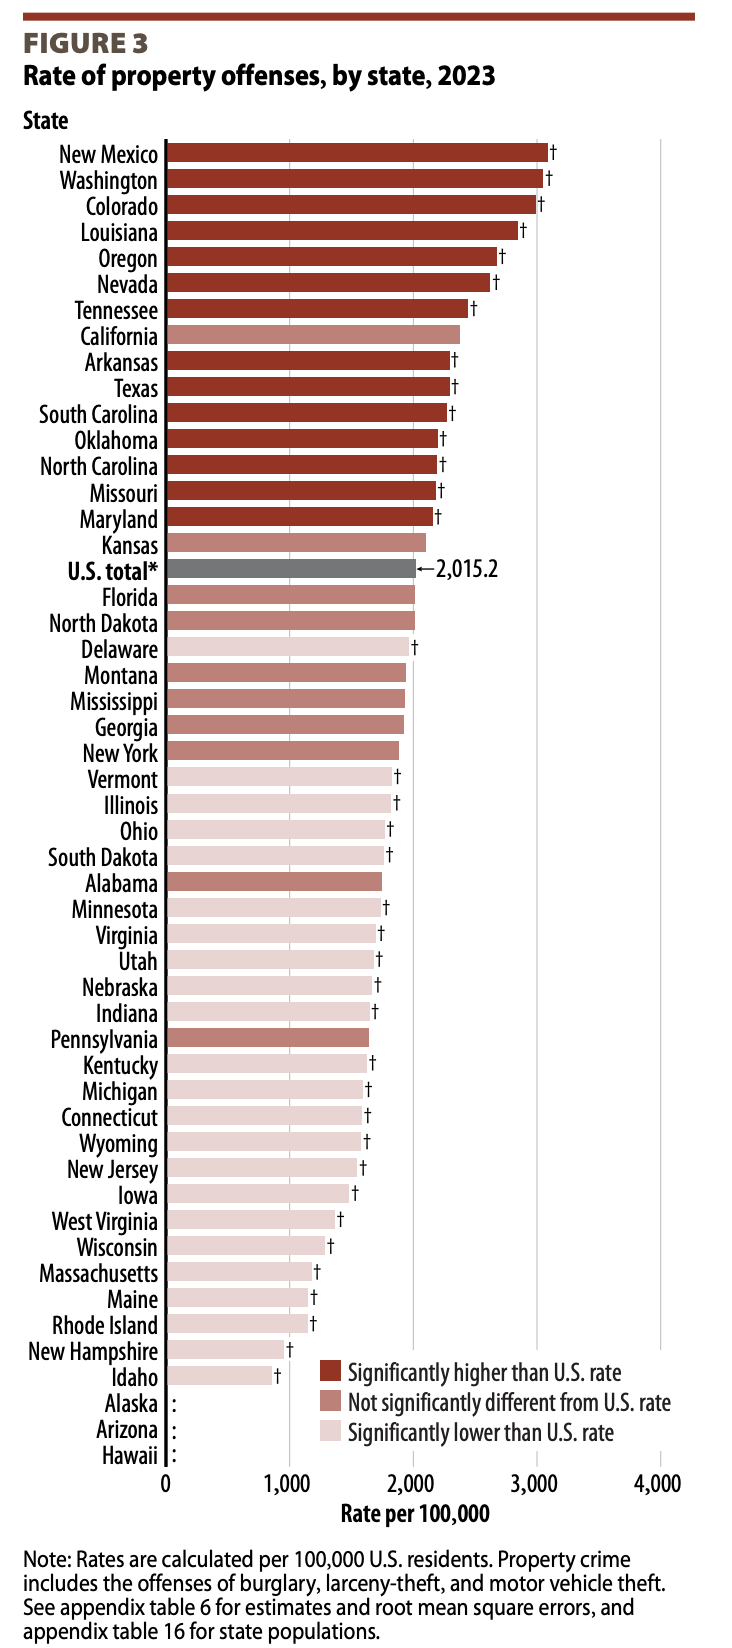
Fourteen states had a property offense rate that was higher than the national rate.
The property offense rate varied across the states, from 3,082.7 property offenses per 100,000 persons in New Mexico to 851.8 per 100,000 in Idaho.
In total, 14 states had a property offense rate that was higher than the national rate of 2,015.2 per 100,000.
The burglary offense rate ranged from 533.8 per 100,000 in New Mexico to 62.5 per 100,000 in New Hampshire.
A total of 13 states had a burglary offense rate that was higher than the national rate of 253.4 per 100,000.
The larceny-theft offense rate ranged from 2,009.1 per 100,000 in Louisiana to 627.1 per 100,000 in Idaho.
A total of 19 states had a larceny-theft offense rate that was higher than the national rate of 1,431.1 per 100,000.
The motor vehicle theft offense rate ranged from 702.3 per 100,000 in Washington to 67.8 per 100,000 in New Hampshire.
A total of 11 states had a motor vehicle theft offense rate that was higher than the national rate of 330.7 per 100,000.
Chart-Property Crimes Per State
Victims Of Crime
The violent victimization rate for females declined from 2022 to 2023. In 2023, the rate of violent victimization was 369.0 per 100,000 females, a decrease from 2022 (393.5 per 100,000).
The rates of rape and aggravated assault victimization also declined among females from 2022 to 2023.
For both males and females, the homicide victimization rate declined from 2022 to 2023.
The violent victimization rate declined for black persons, from 1,011.7 per 100,000 in 2022 to 940.7 per 100,000 in 2023. The victimization rates for the specific offenses of homicide, rape, and aggravated assault also declined for black persons from 2022 to 2023.
White individuals had a violent victimization rate of 307.1 per 100,000 in 2023, which was not significantly different from the 2022 rate (322.7 per 100,000). The 2023 victimization rates of white persons for homicide (3.2 per 100,000) and rape (38.1 per 100,000) were lower than the 2022 rates.
During the same period, Asian, Native Hawaiian or Other Pacific Islander, and American Indian or Alaska Native persons did not experience statistically significant changes in their overall violent crime victimization rates.
From 2022 to 2023, persons age 11 or younger and 18 to 24 experienced decreases in overall violent victimization rates. The violent victimization rate for persons age 11 or younger decreased from 144.5 per 100,000 persons in 2022 to 137.9 per 100,000 in 2023.
For those ages 18 to 24, the violent victimization rate was 737.0 per 100,000 in 2023, compared to 825.7 per 100,000 in 2022. The homicide victimization rate was lower in 2023 compared to 2022 for persons in age groups 64 or younger, while those 65 or older had a similar homicide victimization rate in 2022 (2.1 per 100,000) and 2023 (2.0 per 100,000).
Most statistically significant changes in violent victimization rates from 2022 to 2023 were decreases, with two exceptions. The rate of robbery victimization for persons ages 12 to 17 increased from 2022 (64.2 per 100,000) to 2023 (73.2 per 100,000), and the rate of homicide victimization for Asians increased from 1.2 per 100,000 in 2022 to 1.4 per 100,000 in 2023.
Context-USDOJ’s Two Methods Of Collecting Crime Data
The Bureau of Justice Statistics of the US Department of Justice is better known for offering the National Crime Victimization Survey, which offers dramatically different and higher numbers than the FBI because it’s a record of all crimes excluding homicides (you can’t interview dead people), people under the age of 12, business crimes, plus other categories.
Crimes articulated by the FBI decreased in 2023 to 2024 (the most recent report), with overall decreases ranging from 3 to 4 percent.
However, the National Crime Victimization Survey offered the largest increase in rates of violent crime in the nation’s history in 2022, 44 percent, with rates remaining stable for 2023 and 2024 (latest report). ChatGPT puts the increase at 42 percent.
The nation is currently discussing a national decrease in crime based on those reported to law enforcement, especially in cities. In contrast, the National Crime Victimization Survey is offering record-high rates for violent crime.
Per the Survey’s 2024 report, violence increased in urban areas.
A New Effort To Change How Crime Is Measured Could Reshape What We Think We Know
Crime statistics don’t lie—but they often leave out key pieces of the puzzle. For decades, the U.S. has relied on two very different sources to understand crime:
-
FBI data, which counts crimes reported to police, and
-
The National Crime Victimization Survey (NCVS), which counts crimes that people say happened to them—including those never reported to law enforcement.
Each tells part of the story, but neither gives a complete picture. That’s why crime trends can seem contradictory, and why different groups cite different numbers to make their point.
A Push to Modernize Crime Numbers
Earlier this year, I wrote about an executive order from President Trump directing federal agencies to improve crime data collection. His administration wants more complete, consistent numbers across states and cities. At the time, I noted that combining FBI and NCVS data could give the public a far clearer view of crime than what we currently have.
A new research effort from the Bureau of Justice Statistics (BJS) suggests that federal statisticians are now exploring exactly that idea.
Why This Matters: Reported Crime vs. Actual Crime
Most crimes never reach police files. The NCVS consistently finds that the majority of violent and property crimes go unreported. That means relying on FBI data alone will inevitably undercount crime—sometimes dramatically.
The new BJS research asks a straightforward question:
If we blend police-reported crimes with survey-based victimization data, do we get a different picture of which states have the most crime?
The short answer is yes.
A Real-World Example
I cited FBI data showing that New Mexico had the highest violent crime rate in the country.
But in the new BJS research—where reported and unreported crime data are combined—New Mexico is no longer at the top. In fact, six states show higher estimated violent crime rates when unreported crimes are included.
This doesn’t mean New Mexico got safer. It means other states have more crime than police reports alone suggest.
What the New Study Actually Does
The study is titled Bayesian Estimation of State-Level Crime Victimization Rates. While the name is technical, the purpose is simple:
Create the most realistic estimate of crime possible by combining both major national crime data sources.
Key points:
-
This is NOT an official ranking of state crime rates from the USDOJ.
-
It is a research test, exploring whether combining data sources can reveal more accurate numbers.
-
It uses “small-area estimation” techniques—essentially statistics that allow crime estimates to be created even for places where the NCVS doesn’t have enough respondents.
-
The result is a 50-state and D.C. (2020-2022) estimate for violent and property crime that includes both reported and unreported offenses.
- Readers (especially reporters) should not use this data publicly. This BJS report is not a source of official state-level crime numbers. It’s an experimental study testing whether two very different crime data systems can be mathematically combined. The results include impossible numbers like zero-crime states, weak connections between police data and victimization data, and regional errors that make entire areas look safer or more dangerous than they are. BJS itself cautions that these are research estimates, not real crime statistics. Reporters should not use them as factual crime rates.”
Why This Approach Could Change Everything
If the federal government eventually adopts this method, it would mean:
-
State rankings could shift dramatically.
-
Reported declines in crime might look smaller—or larger—when unreported crime is included.
-
The public would see a more realistic picture of crime risk in their state.
-
Policymakers would have a clearer idea of where resources are truly needed.
BJS explored versions of this idea in earlier reports about using the NCVS to produce city and state estimates. This newest study appears to be the strongest effort yet to merge FBI data and victim surveys into one unified system.
To review previous efforts to use local NCVS data, see the bottom of City and State Crime Rates-Most Dangerous Cities.
ChatGPT
Privacy Policy
We do not collect your personal information. See our privacy policy at “About This Site.”
See More
See more articles on crime and justice at Crime in America.
Most Dangerous Cities/States/Countries at Most Dangerous Cities.
US Crime Rates at Nationwide Crime Rates.
National Offender Recidivism Rates at Offender Recidivism.
The Crime in America.Net RSS feed (https://crimeinamerica.net/?feed=rss2) provides subscribers with a means to stay informed about the latest news, publications, and other announcements from the site.
One Reply to “USDOJ-States With The Highest Rates For Violent And Property Crimes”