

Highlights
FBI hate crime numbers rose by 35 percent in 2021 based on reported incidents per The Hill (newspaper of Congress). Per the Bureau of Justice Statistics, hate crime rates are mostly flat for the time period measured.
There are vastly different numbers for hate crimes offered by two US Department of Justice agencies.
Based on the two federal sources, one can make any claim they want as to hate crimes. The USDOJ needs better reporting and context.
Author
Article
The data below is a summation by The Hill (newspaper of Congress) the FBI and the Bureau of Justice Statistics (BJS) as to hate crime statistics. It includes FBI and BJS charts addressing numbers, rates, and offenders.
The data is difficult to grasp. The media will tell you that hate crimes have increased substantially (with big increases for Asians and LGBT individuals) yet “rates” of hate crimes presented by the Bureau of Justice Statistics are flat.
For context, Asians-Pacific’s constituted 5.7 percent of all hate crimes per the Bureau Of Justice Statistics. The percentage for other groups is vastly higher.
Notes
FBI data refers to a supplemental report-addition. It involved a special outreach to law enforcement agencies that did not report hate crimes per The Marshall Project.
The FBI’s new National Incident-Based Reporting System has issues with participation, only 52 percent of law enforcement agencies provided full yearly data for 2021.
Some context as to the rise in overall crime in 2021 is included. If there are increases in reported hate crimes, are numbers influenced by overall increases in violence?
The FBI’s report (below) cites the progression from the old Uniform Crime Reporting program and the emerging National Incident-Based Reporting System. An explanation of the two systems is available at Violent and Property Crime Rates.
The hate crime numbers and demographics offered by the FBI and the Bureau of Justice Statistics greatly differ.
Hate Crimes Increase Per “The Hill”
Hate crimes in the United States spiked by 35 percent in 2021 according to FBI statistics, led by a sharp rise in attacks motivated by sexual orientation.
The FBI recorded a total of 10,840 hate crime incidents in 2021, up from 8,052 in 2020, according to a supplemental addition to the agency’s annual hate crimes report.
Source
FBI 2021 Hate Crime Statistics
The FBI’s Uniform Crime Reporting (UCR) Program released a 2021 hate crime statistics supplement about bias-motivated incidents throughout the nation.
For the 2021 data year, the UCR Program accepted Summary Reporting System (SRS) hate crime data submissions and additional National Incident-Based Reporting System (NIBRS) hate crime reports from 3,025 agencies that covered a combined population of 87,239,467 to help compile this special report (editor’s note-the population of the US is 321 million).
Nationally, reported hate crime incidents increased 11.6% from 8,120 in 2020 to 9,065 in 2021 (editor’s note-a vastly smaller increase than the 35 percent increase reported by “The Hill” based on the 10,840 figure. Why the FBI did not offer a percentage increase based on the supplemental report’s 10,840 number is unknown).
While the NIBRS 2021 hate crime dataset reported 7,262 incidents and 8,673 related offenses as being motivated by bias toward race, ethnicity, ancestry, religion, sexual orientation, disability, gender, and gender identity, the supplemental hate crime dataset reports involve 10,840 incidents and 12,411 related offenses.
The supplemental reporting figure is higher as it represents a larger population as more agencies were able to submit via the SRS system.
Victims of Hate Crime Incidents
- Over 10,500 single-bias incidents involved 12,411 victims.
- A percent distribution of victims by bias type shows that
- 64.5% of victims were targeted because of the offenders’ race/ethnicity/ancestry bias,
- 15.9% were targeted because of the offenders’ sexual-orientation bias,
- 14.1% were targeted because of the offenders’ religious bias,
- 3.2% were targeted because of the offenders’ gender identity bias,
- 1.4% were targeted because of the offenders’ disability bias, and
- 1.0% were targeted because of the offenders’ gender bias.
- There were 310 multiple-bias hate crime incidents that involved 411 victims.
Offenses by Crime Category
- Of the 8,327 hate crime offenses classified as crimes against persons in the updated 2021 dataset,
- 43.2% were intimidation,
- 35.5% were simple assault, and
- 20.1% were aggravated assault.
- 19 rapes and 18 murders were reported as hate crimes.
- The remaining 70 hate crime offenses classified as crimes against persons were reported in the category of other.
- Of the 3,817 hate crime offenses classified as crimes against property, 71.2% were acts of destruction/damage/vandalism.
- 267 additional offenses were classified as crimes against society. This crime category represents society’s prohibition against engaging in certain types of activity such as gambling, prostitution, and drug violations. These are typically victimless crimes in which property is not the object.
Hate Crime Statistics, 2021, is available as a downloadable on the FBI’s Crime Data Explorer at cde.ucr.cjis.gov.
FBI Hate Crimes-Numbers And Offenders

Source
Context-Comparison Data-Violent Crimes-2021
Regardless of what percentage increase you use for FBI hate crimes, overall violent crimes were up considerably which may affect our understanding of hate crime numbers. Violence tends to increase or decrease as a group.
Per the FBI, homicides increased considerably between 2019 and 2021 (nearly 30 percent in 2020 and 4.3 percent in 2021) and murders have been traditionally used by criminologists as an indicator of all violent crime. Rapes also increased in 2021.
Per the Major Cities Chiefs Association, compared to 2019 midyear figures, participating cities in total have experienced a 50% increase in homicides and a roughly 36% increase in aggravated assaults.
The 2021 US firearm homicides (81 percent of all murders) were the highest since the 1990s, Centers For Disease Control (CDC) data show. They recorded an 8.3 percent increase in 2021, CNN.
The risk of victimization while a person was out in public rose by nearly 40% by April 2020, National Academy Of Sciences.
From 2020 to 2021, the violent victimization rate increased from 19.0 to 24.5 victimizations per 1,000 persons in urban areas while remaining unchanged in suburban or rural areas. The rate of serious (excluding common assaults) violent victimization in urban areas also increased, per the Bureau of Justice Statistics National Crime Victimization Survey.
Per Gallup, there is a big increase in the criminal victimization of urban households in 2021, 30 percent compared to 22 percent in 2020. Seven percent of urban residents were violently victimized compared to 3% of U.S. adults. The collective data (urban crime victimization-computer crime) indicates a growing crime problem for at least half of American households (link below).
Source
Violent And Property Crimes in The US
Bureau Of Justice Statistics Hate Crime Reports-Released In 2021 And 2022
The Bureau of Justice Statistics relies on surveys rather than crimes reported to law enforcement. Both the BJS and the FBI are US Department of Justice Agencies. The great majority of crimes in the US are not reported to law enforcement thus the need for a survey.
The “rate” of hate crimes remains mostly flat (see the chart below and a prior report).
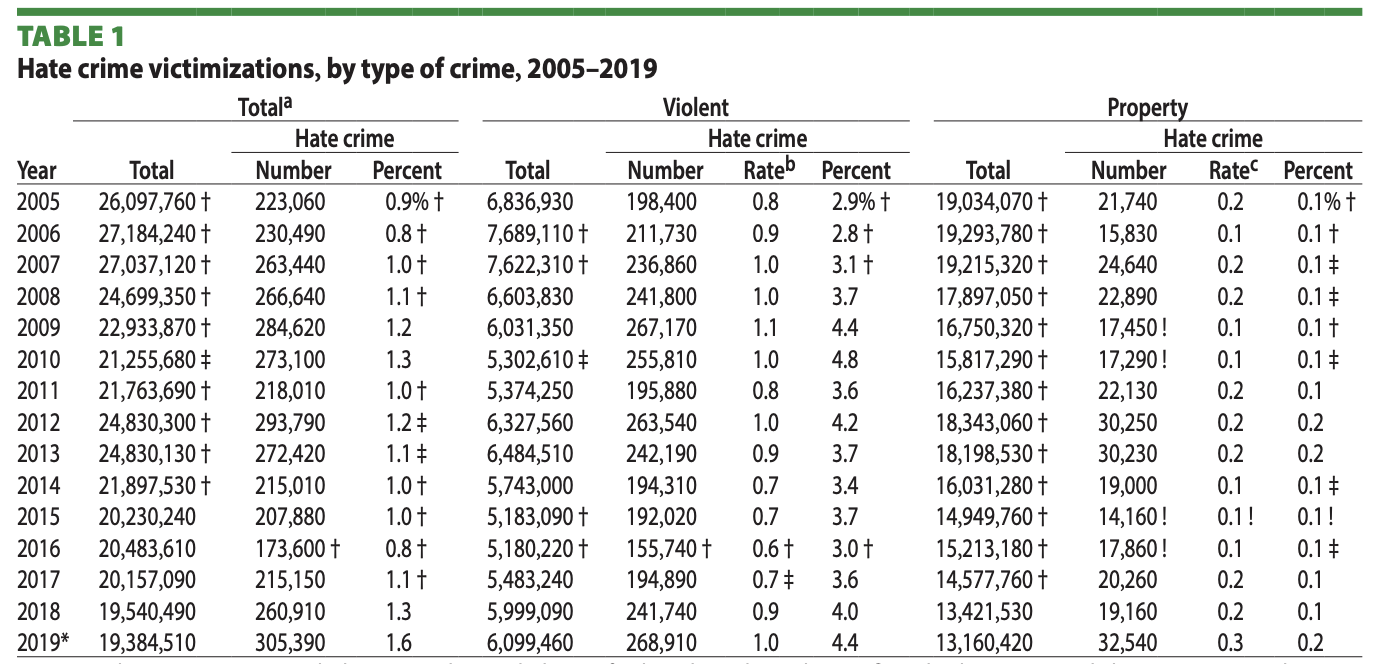
On average, U.S. residents experienced approximately 246,900 hate crime victimizations each year between 2005 and 2019 (editor’s note, versus 10,840 reported by the FBI).
The number of hate crimes ranged from about 173,600 to 305,390 during this period.
During the five-year aggregate period of 2015-19, the majority of hate crimes involved simple assault (62%) and aggravated assault (18%).
During 2015-19, approximately 42% of violent hate crime victimizations were not reported to police.
The most common reason that victims gave for not reporting to police was that the victimization was handled another way, such as privately or through a non-law enforcement official.
During 2015-19, an estimated 59% of violent hate crime victimizations reported by victims were motivated by bias against their race, ethnicity, or national origin.
Source
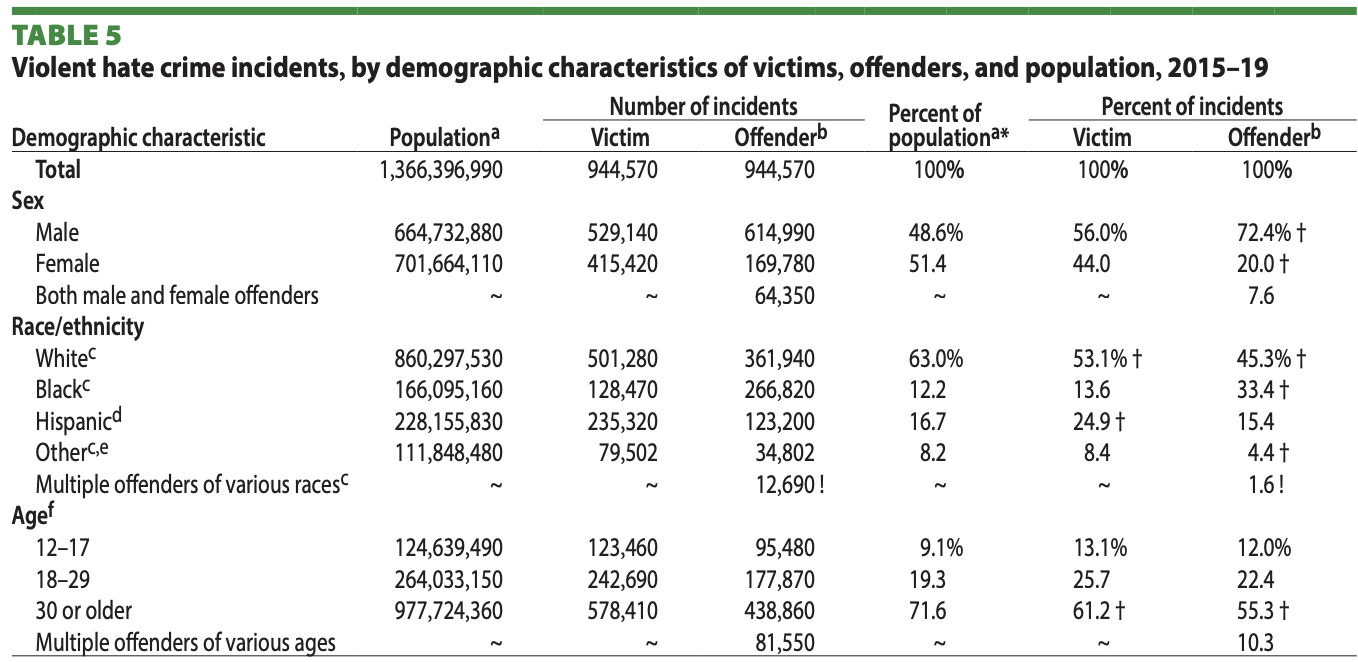
Bureau Of Justice Statistics Chart-Victims And Offenders
Bureau Of Justice Statistics-Hate Crime Rates Over Time
Conclusions
Any hate crime is repulsive in a country that values equality. Regardless of numbers or rates, hate crimes should be universally condemned. One can argue rates and numbers and who’s affected but it’s meaningless to victims who need our support.
My Jewish and Asian and black friends have to live with increased fear that is real regardless of statistics. That’s tragic.
Just recognize that the FBI’s report is an undercount based on the lack of participating law enforcement agencies. Ratios (per 1,000) seem small for some groups but until we have better participation, we won’t know the true impact of “reported” hate crimes.
The FBI cites a variety of numbers of hate crimes based on different reports which makes understanding the problem confusing. It took an article from the Marshall Project to explain differences based on “supplemental” data.
Beyond law enforcement participation, the FBI numbers are undercounted based on a lack of citizens reporting hate crimes.
The increase in “reported” hate crimes seems concurrent with the rise in overall violence.
The FBI is reporting 10,840 hate crime incidents compared to the Bureau of Justice Statistics 247,000 yearly figure. The difference is so large that it makes an understanding of the problem complex.
For policy matters, it seems that the data from the Bureau of Justice Statistics via a survey is more impactful based on much larger numbers to analyze. Methodology 101, the larger the numbers, the more accurate the results.
Readers need to understand the dynamics of hate crime reports (i.e., reasons for not reporting incidents-crimes committed by someone the victim knows). Numbers can be meaningless without context. Bias statements between friends or associates are likely going to be substantially different in nature when compared to stranger-to-stranger violence.
Settling disputes between people who know each other is often seen as a private matter that does not require police intervention.
According to the Bureau Of Justice Statistics, hate crimes offenders were most likely to be men (72%) and strangers (56%), which means that close to half of the victims knew their offenders (editor’s notes, for context, most violent crime happens between people who know each other).
In the final analysis, federal data on hate crimes seems wildly inconsistent. The US Department of Justice needs to create readable and understandable reports combining FBI and Bureau of Justice Statistics numbers and rates plus explanations to make sense of the data. Not doing so leads to misinterpretations or falsehoods.
Based on the two federal sources, one can make any claim they want as to increases (or lack of increases), who’s affected, and victimization based on groups.
Based on Bureau of Justice Statistics numbers, white individuals have the highest numbers of hate crime victimizations representing 53 percent of incidents yet I doubt that this statistic provides the context necessary to understand hate victimizations.
With 63 percent of the US consisting of white individuals, 53 percent of hate incidents are placed in context along with white gender, religion, or sexual preference discrimination.
While acknowledging that every hate crime is serious, the lack of context makes understanding hate crimes difficult.
Hate Crime Offenders
A study on hate crime offenders is available.
Privacy Policy
We do not collect your personal information. See our privacy policy at “About This Site.”
See More
See more articles on crime and justice at Crime in America.
Most Dangerous Cities/States/Countries at Most Dangerous Cities.
US Crime Rates at Nationwide Crime Rates.
National Offender Recidivism Rates at Offender Recidivism.
The Crime in America.Net RSS feed (https://crimeinamerica.net/?feed=rss2) provides subscribers with a means to stay informed about the latest news, publications, and other announcements from the site.