
Highlights
Is crime increasing or decreasing? According to reports from the US Department of Justice, it’s both.
Understanding national crime data is getting harder than ever.
Author
Article
When I became the senior specialist for crime prevention for the US Department of Justice’s clearinghouse, I spent the first months answering questions about crime rates and totals via the FBI and the Bureau of Justice Statistics.
Why am I doing this, I asked my superiors? Wouldn’t these questions be better answered by the agencies putting out the statistics? It seems that my inquiry was a moot point; the questions kept coming and the FBI and the BJS didn’t seem to mind. In fact, they supported me by giving me access to their statisticians and special data runs.
Explaining-understanding national crime data takes time and a willingness to acknowledge the complexities. Questions about national crime statistics (including police command staff) continue today.
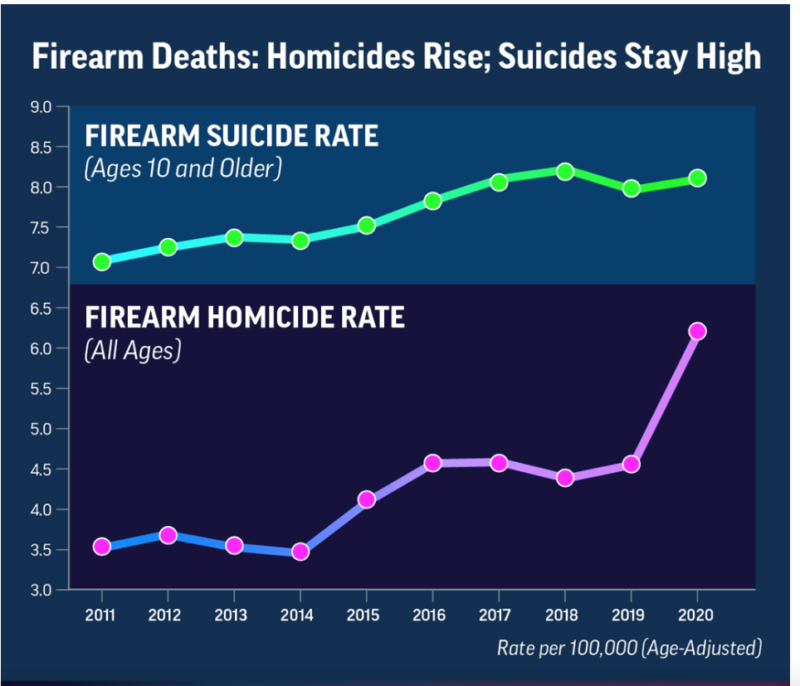
Take my use of firearm-homicide data from the Centers For Disease Control (CDC) for the photo in this article. Their report on firearm violence got an immense amount of publicity “but” their data offered nothing that didn’t already exist via the FBI.
There was an insightful analysis of firearm crime data from the Bureau of Justice Statistics stating that the vast majority of violence doesn’t involve firearms which was ignored by the media. Why did the media embrace the CDC’s homicide data but ignore far more comprehensive research on all firearm violence offered by BJS? I guess that a focus on homicides (which involve a preponderance of firearms) rather than all violent crimes from BJS (with limited involvement of guns) fits preconceived notions.
The questions about crime data and its relevancy continue which is why I wrote Violent And Property Crime rates in The United States to provide a comprehensive overview of crime rates and totals along with other measures (i.e., fear of crime and data from Gallup). It’s designed to offer the most important crime statistics in one place.
Understanding crime and violence in the US is hard. It’s confusing. Advocates push narratives with limited data to willing reporters (i.e., violence interrupters) who don’t understand nuances resulting in misleading articles. Some examples of the complexity of understanding crime are below.
Editor’s Note
All quotes below are edited for brevity.
School Crime-ABC News
Across America, one of the nation’s most difficult academic years was also one of the most violent. Experts who track school behavior nationwide said fights and other aggressive behavior, including shootings, appear to have increased.
Educators and psychologists say the pandemic contributed to the volatility in schools by causing a surge in student mental health problems, trauma at home, a lack of socializing opportunities, and a shortage of teachers and counselors that reduced adult supervision and guidance.
There is no national data that tracks school fights and assaults, but education officials across the country say violence erupted more often and more fiercely.
Source ABC News
School Crime-US Department of Justice Data
In 2020, students ages 12 to 18 experienced 285,400 victimizations at school and 380,900 victimizations away from school.
From 2019 to 2020, the total victimization rate at school decreased from 30 victimizations per 1,000 students to 11 victimizations per 1,000 students—a decrease of more than 60 percent (emphasis added).
Source Bureau Of Justice Statistics
Analysis
So which is it, an explosion of school violence or a reduction of 60 percent? The article refers to more recent years and the BJS data is from 2020, but it simply can’t be both an explosion and a huge decrease. Crime counts traditionally rise and fall at far smaller numbers.
Crime in The US-Bureau of Justice Statistics (BJS) National Crime Victimization Survey-2020 (latest data)
The Bureau of Justice Statistics (BJS) of the US Department of Justice states that the violent victimization rate dropped 22 percent in 2020, Criminal Victimization 2020.
This is the largest decrease in violence ever reported by the Bureau of Justice Statistics (emphasis added).
The announcement was startling. Everyone expected BJS to document increasing violence based on FBI and many additional reports that violent crime increased considerably.
Crime in The US-FBI-2020 (latest data)
Per 2020 FBI final statistics released in September 2021, the number of homicides increased nearly 30% from 2019, the largest single-year increase the agency has recorded since it began tracking these crimes in the 1960s. There were more than 21,500 murders last year, a total not seen since the mid-1990s.
In 2020, violent crime was up 5.6 percent from the 2019 number. The estimated number of aggravated assault offenses rose 12.1 percent, and the volume of murder and nonnegligent manslaughter offenses increased 29.4 percent.
The estimated number of robbery offenses fell 9.3 percent and the estimated volume of rape (revised definition) offenses decreased 12.0 percent. Property crimes continued to decrease. The exception is motor vehicle thefts which rose 11.8 percent, Homicides and Violent Crime Increases.
Analysis
2020 is the latest data we have from the FBI and the Bureau of Justice Statistics. So which is it, the largest single-year increase in homicides or the largest decrease in violence ever reported by the Bureau of Justice Statistics? Yes, the Bureau of Justice Statistics and their national survey doesn’t measure homicides (you can’t interview dead people) but murders have historically been used as a proxy for overall violence.
Missing Data From Law Enforcement Agencies
Nearly 40% of law enforcement agencies around the country did not submit any data in 2021 to a newly revised FBI crime statistics collection program.
The gap includes the nation’s two largest cities by population, New York City and Los Angeles, as well as most agencies in five of the six most populous states: California, New York, Illinois, Pennsylvania, and Florida.
In 2021, the FBI retired its nearly century-old national crime data collection program, the Summary Reporting System used by the Uniform Crime Reporting (UCR) program. The agency switched to a new system, the National Incident-Based Reporting System (NIBRS), which gathers more specific information on each incident. Even though the FBI announced the transition years ago and the federal government spent hundreds of millions of dollars to help local police make the switch, about 7,000 of the nation’s 18,000 law enforcement agencies did not successfully send crime data to the voluntary program last year.
Source The Marshall Project
Analysis
The FBI did not report data for the first quarter of 2021 because not enough police agencies participated. But about 60 percent did. The promise was that the Bureau of Justice Statistics would extrapolate from existing data and fill in the gaps. What happened?
Is Overall Crime Increasing Or Is It Just Violence?
A historic rise in homicides in 2020—and continued bloodshed in 2021—has incited fears that after years of plummeting crime rates, the U.S. could be headed back to the bad old days, when a crime wave gripped the country from the 1970s to the 1990s.
But the FBI’s “Uniform Crime Report” for 2020, suggests something stranger: Perhaps America is in the midst of what is specifically a violence wave, not a broad crime wave. Even as violent crime rose, led by significant jumps in murders and aggravated assaults, property crime continued a years-long decline.
Source The Atlantic
Analysis
When I left law enforcement and went to college, my criminology professors taught me that, generally speaking, “all” crime rises and decreases uniformly over time. Not only did this occur in the US, but it happened in most industrialized countries; crime increased or decreased for all or most, just not at the exact time or volume.
“The Atlantic” is correct. In recent years, reported property crimes have mostly decreased with some exceptions for auto theft although there seem to be the beginnings of increased property crimes in several cities.
Conclusions-Suggestions
There are additional observations and examples I could add such as the Bureau of Justice Statistics and 2019 data that went from being flat to decreasing. Data has a way of changing when researchers re-run numbers. I’m not suggesting anything nefarious. But the bottom line is that a BJS chart showed decreases in violent crime in 2019 which is different from what the Bureau of Justice Statistics previously offered through official reports.
First, I’m suggesting that readers be cautious with crime data. According to the ABC news article cited above, school crime is exploding in proximity with a report from the Bureau of Justice Statistics stating that school crime dropped 60 percent. The article erroneously stated that there are no national statistics on school crime. What you read and what really is can be two different things.
Second, understand that only 40 percent of violent crimes are reported to law enforcement. It’s much less for property crime, which is why we have the Bureau of Justice Statistics-National Crime Victimization Survey.
Third, there are vast differences between the crimes reported to law enforcement via the FBI and the Bureau of Justice Statistics which is a statistical measure of “all” crime. Counting and examining the missing 60 percent of violent crimes can (and do) create differences between the two national reports.
Fourth, as a personal observation, I tend to have more faith in the FBI’s data on reported crimes as a measure of what’s happening throughout the country. The Bureau of Justice Statistics-National Crime Victimization Survey measures “crimes” that will never be reported to law enforcement because they are often “personal” events; a friend hits you with a beer bottle after you insult his wife after a night of drinking, which is technically an aggravated assault. It won’t be reported to law enforcement but when the Bureau of Justice Statistics calls with their victimization survey, you will probably tell them that “someone you know” hit you with a weapon. Remember that most violent crime involves people who know each other.
I tend to believe (like others before me) that crimes reported to law enforcement are more serious in nature, often falling into the stranger-to-stranger or personal violence with injury categories.
Finally, measuring crime has endless barriers like COVID and the ability of the Bureau of Justice Statistics to conduct surveys. Arrests plummeted in 2020 and that may be an indication that fewer crimes were being reported or that law enforcement was reluctant to make arrests because of the spreading disease.
The vast majority of what we consume about crime comes from mainstream media. Just because a news source tells you that violence is up or down doesn’t mean that it’s correct. The legion of national, state, and local crime reporters who fully understood the numbers have almost disappeared. Good data and accurate observations are getting harder to find because fewer reporters are knowledgeable. Like the example above on gun violence, reporters can cherry-pick data or not understand that additional research provides a more nuanced interpretation.
So how do we understand the impact of crime? I tend to pay attention to fear of crime data (which often conflicts with official crime numbers) and crime statistics via local and state law enforcement (yes, many criminologists will disagree with my observations). Rising fear of crime and recent local-state crime data (via multiple locations) may be better indicators of what’s happening than older national statistics. Just understand that increases in crime for large or medium-sized cities doesn’t mean that they apply to all jurisdictions.
The latest national data (2020) is getting old but I get daily media and official reports that violence continues to rise in urban areas. This tells me that violence in the US continues to grow. This is said with the understanding that because violence is increasing in cities doesn’t mean that it’s growing for the country (but it probably is).
See More
See more articles on crime and justice at Crime in America.
Most Dangerous Cities/States/Countries at Most Dangerous Cities.
US Crime Rates at Nationwide Crime Rates.
National Offender Recidivism Rates at Offender Recidivism.
An Overview Of Data On Mental Health at Mental Health And Crime.
The Crime in America.Net RSS feed (https://crimeinamerica.net/?feed=rss2) provides subscribers with a means to stay informed about the latest news, publications, and other announcements from the site.