

Highlights
An overview of rates and numbers of violent criminal victimizations by race and heritage, all common questions from politicians, students, and the media.
Author
Leonard Adam Sipes, Jr.
Retired federal senior spokesperson. Thirty-five years of directing award-winning public relations for national and state criminal justice agencies. Interviewed multiple times by every national news outlet. Former Senior Specialist for Crime Prevention for the Department of Justice’s clearinghouse. Former Director of Information Services, National Crime Prevention Council. Former Adjunct Associate Professor of Criminology and Public affairs-University of Maryland, University College. Former advisor to presidential and gubernatorial campaigns. Former advisor to the “McGruff-Take a Bite Out of Crime” national media campaign. Certificate of Advanced Study-Johns Hopkins University. Former police officer. Aspiring drummer.
Author of ”Success With The Media: Everything You Need To Survive Reporters and Your Organization” available at Amazon and additional booksellers.
Quotes
All quotes are edited for brevity.
Article
The Bureau of Justice Statistics of the US Department of Justice released charts and observations as to violent criminal victimization by race of victims and offenders through the National Crime Victimization Survey. The charts are below.
Please note that identification of race or Hispanic origin is a judgment call by crime victims and those questioned about their victimizations can be wrong. There are research reports suggesting that crime victims often misidentify their offenders on a variety of variables. Witnesses often focus on weapons, not the identity of the perpetrator; cross-racial eyewitness identifications are known to be incredibly suspect
Two National Measures of Violence-The FBI, the National Crime Victimization Survey
The average person simply wants to know if crime went up or down, but the answer is confusing due to two measures used (victimization surveys via the National Crime Victimization Survey and crimes reported to police via the Uniform Crime Report from the FBI).
Both the National Crime Victimization Survey and the Uniform Crime Report are products of two agencies within the US Department of Justice, the Federal Bureau of Investigation, and the Bureau of Justice Statistics.
There are an endless number of violent crimes that are not reported (thus the need for the National Crime Victimization Survey) because participants can see the event as a private matter, or not serious enough to report to the police.
Most violent and property crimes are not reported to the police, thus the majority of violent and property crime victims do not want police involvement or do not see it as being in their best interest to report the incident or do not believe that law enforcement can do anything about the incident, or are too afraid to report.
Some simplify the two measures by suggesting that crimes reported to law enforcement through the FBI are a measure of events crime victims deem serious (serious enough to report) versus a measure of all crime (regardless of significance) through the National Crime Victimization Survey.
Note that the FBI is transitioning from the Uniform Crime Reports to the National Incident-Based Reporting System which will provide more detail and higher-quality information on criminal activity in the United States. The NIBRS is slated to replace the traditional Uniform Crime Reports.
Currently, the FBI is having problems with the number of law enforcement agencies reporting their data in a new format. The National Crime Victimization Survey is also contemplating a redesign with reports coming from outside researchers.
I Did Not Include Notes
I usually do not include notes when publishing National Crime Victimization Survey data but it’s important for readers to log onto the site and review the notes for yourself. Why?
Because if you look at the first chart for overall victimization data you will see that the “other” (and by far the largest in terms of rates) category includes two or more races (among other variables) and duel race individuals have always had higher rates of violent criminal victimization per the Bureau of Justice Statistics.
To understand this data, you have to pay attention to the notes. You will be looking at a combination of rates and numbers.
Rate Of Violent Victimization By Race
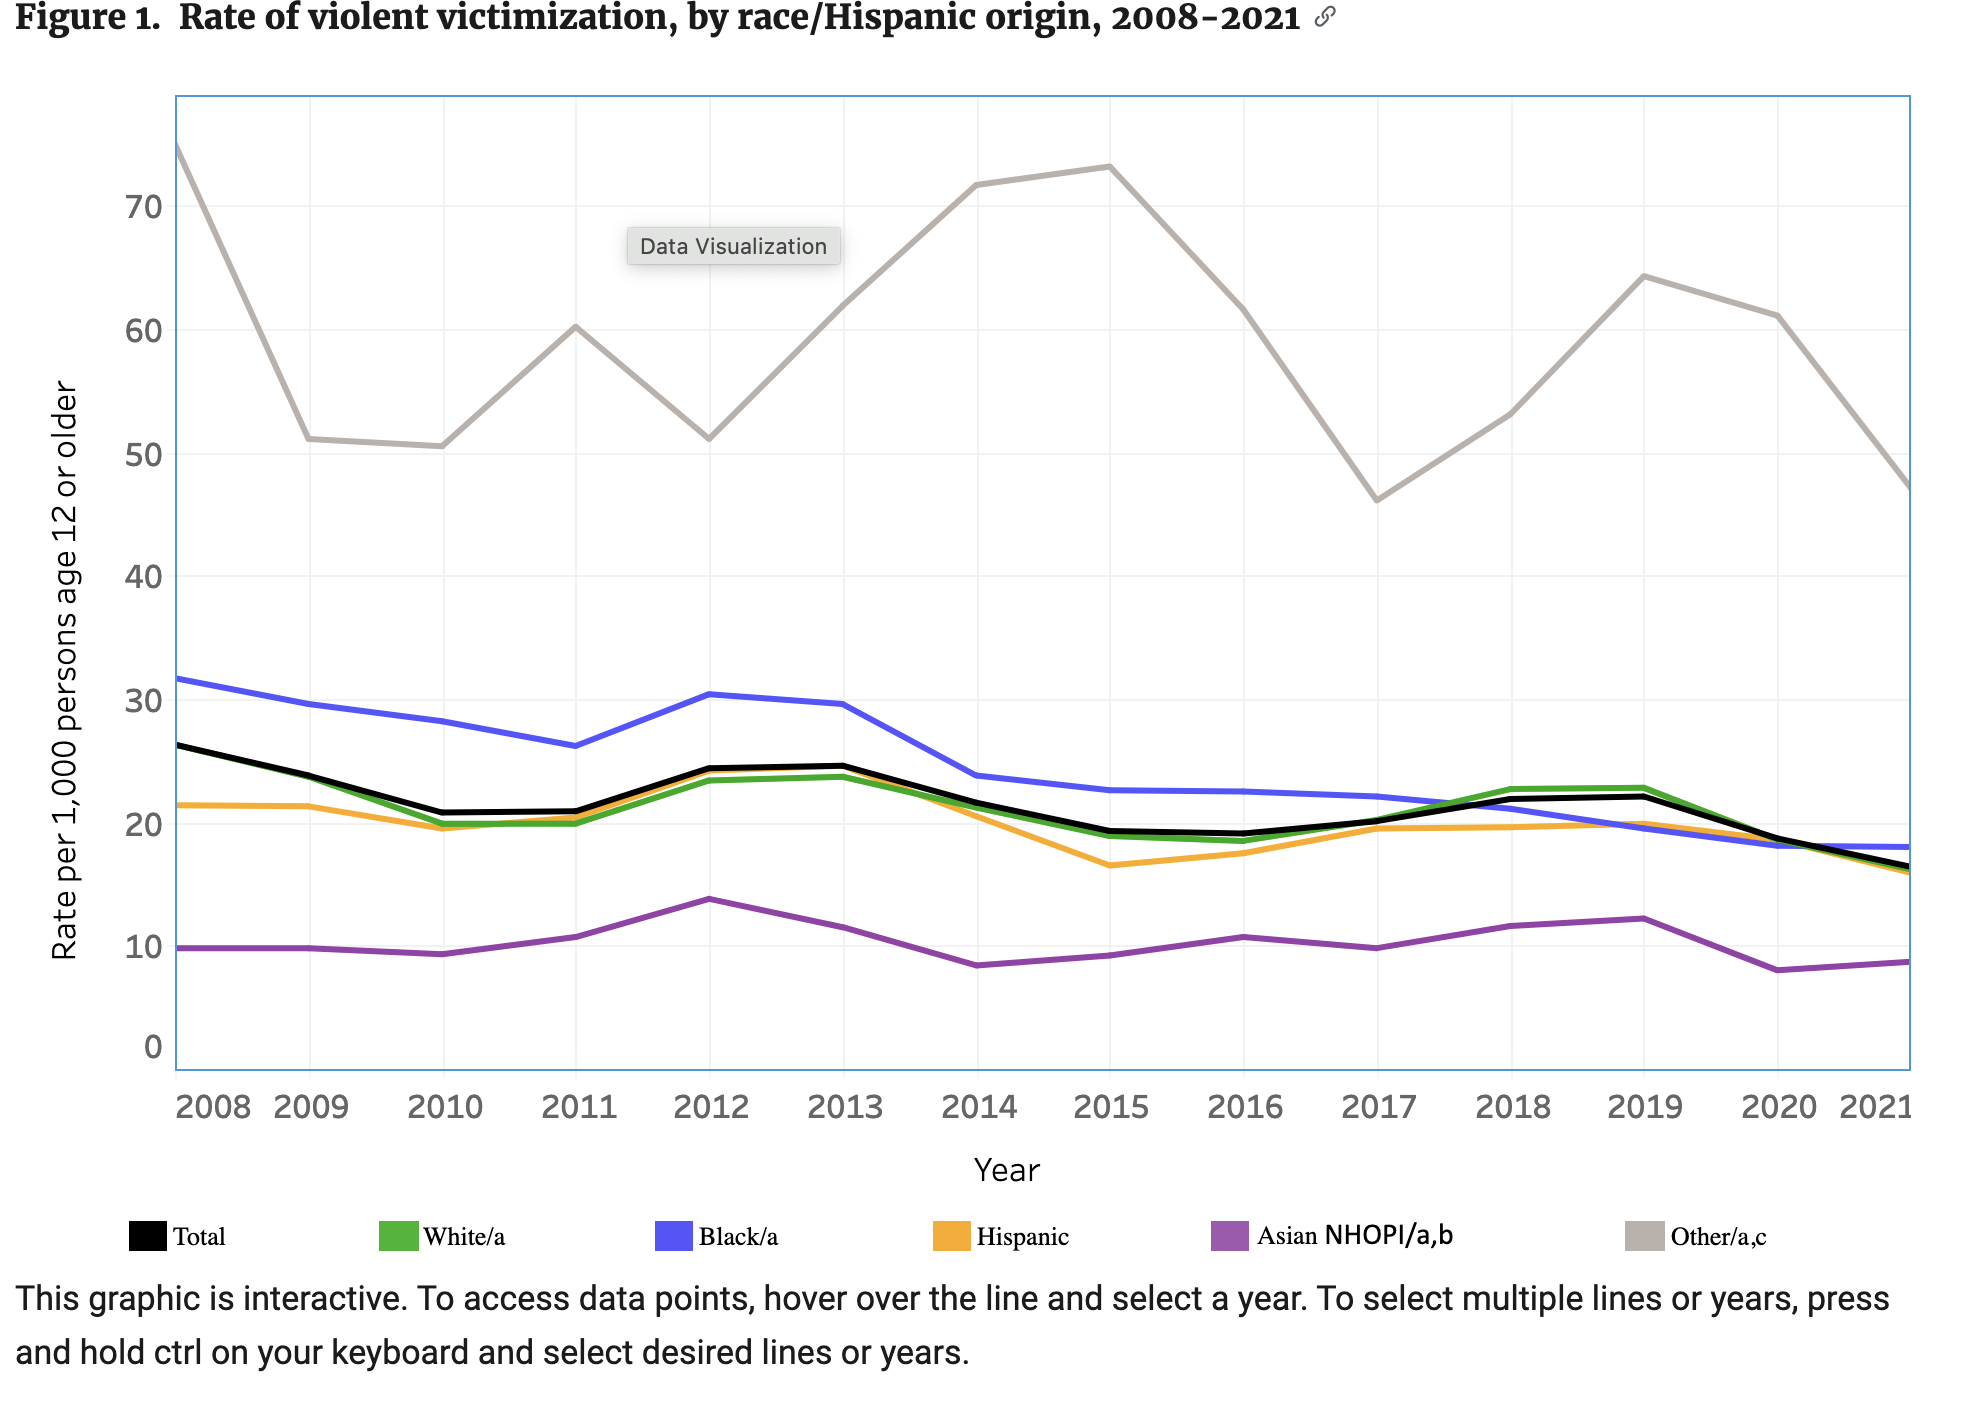
Rates Of Violent Victimization By Race And Category
The overall rate of violent victimization is somewhat equal per the chart above (except for Asians-OPIs and native Hawaiians). Black victimization has traditionally been higher than other groups but that seems to have leveled off.
It’s interesting that female violent victimization (not covered by these charts) was traditionally lower than males but now, females are either equal or in some cases higher, thus indicating that violent criminal victimization changes over time and impacts groups in different ways.
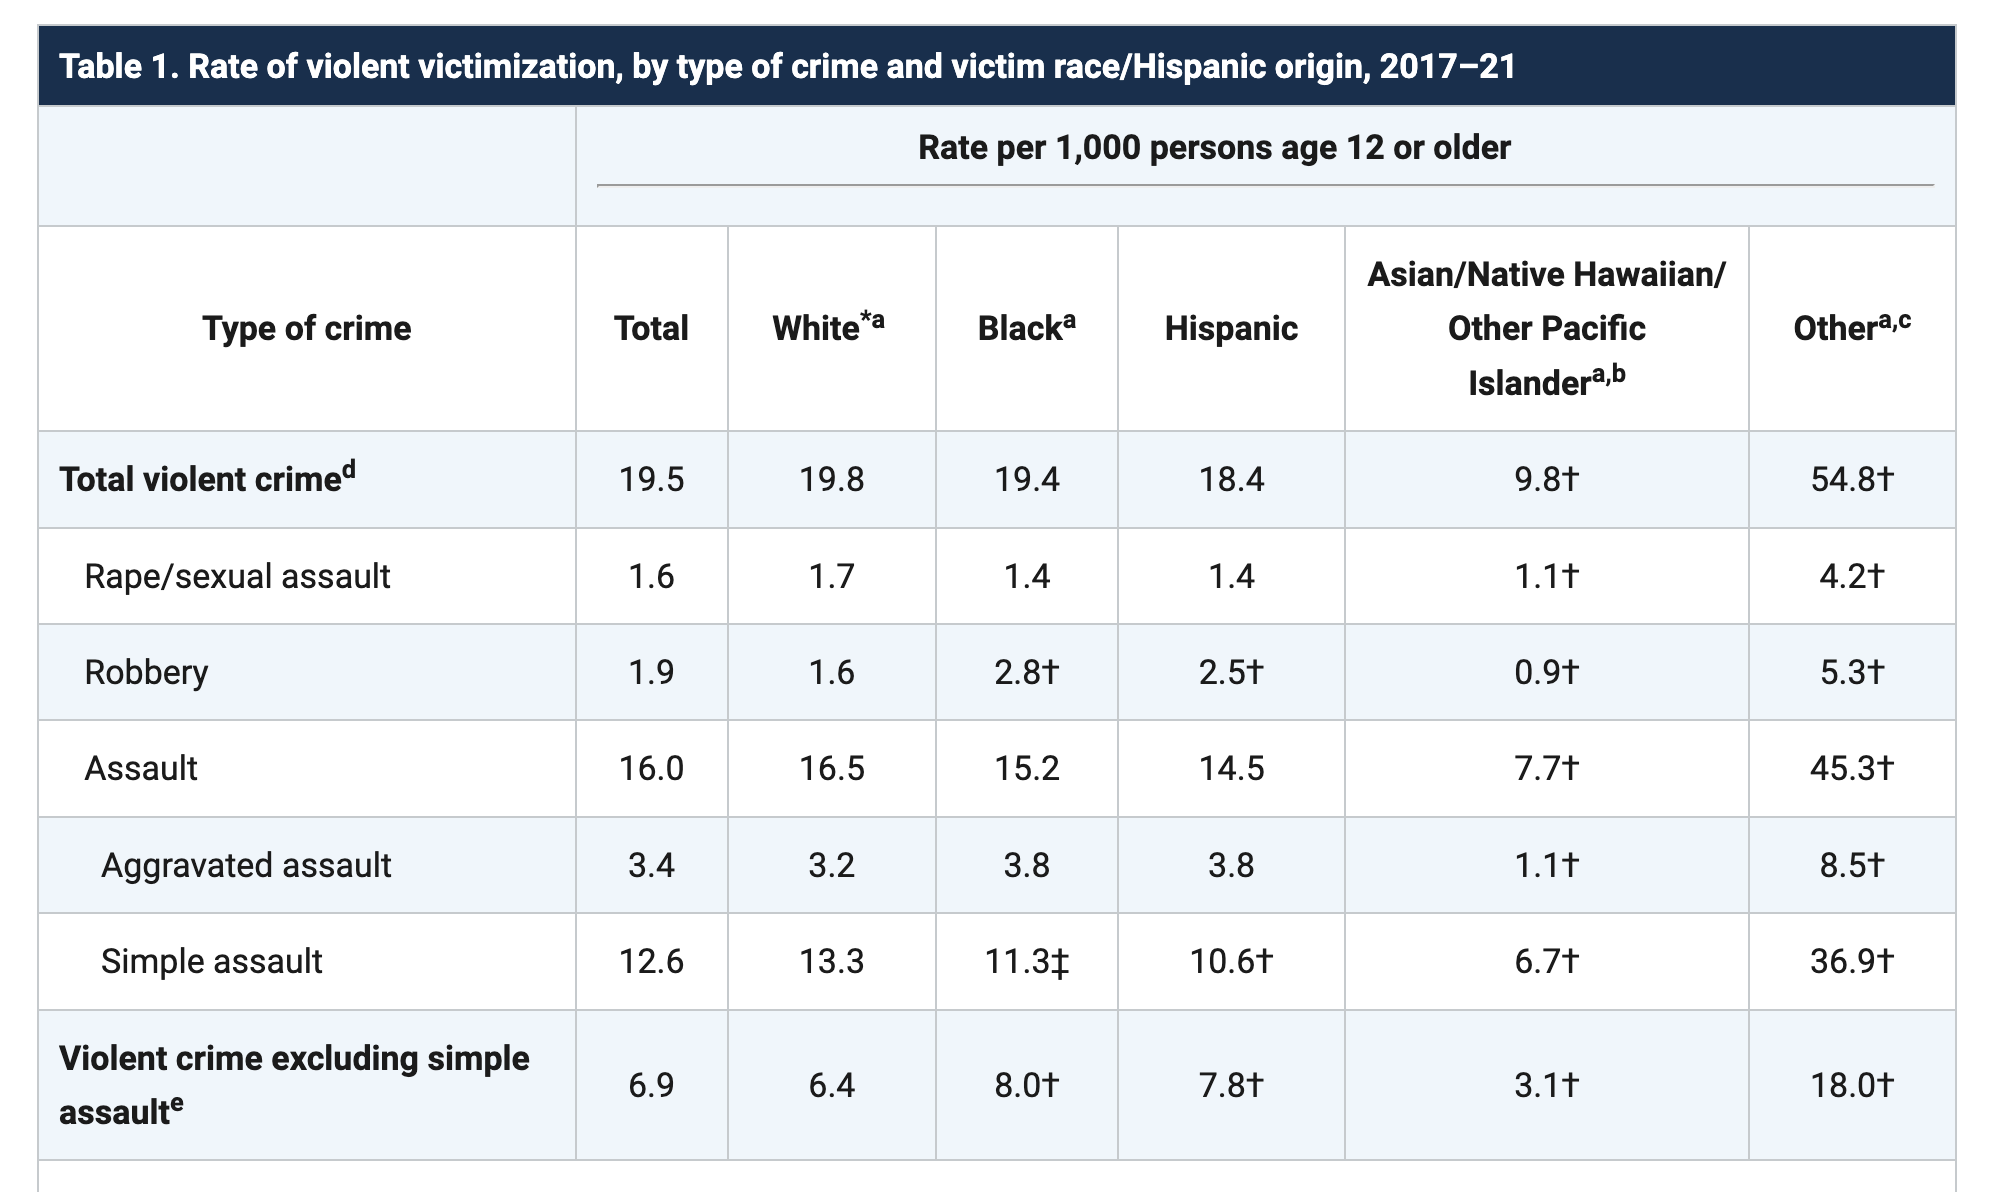
Per the next chart (below), the major differences as to race or origin are two categories of serious violent victimization with African Americans and Hispanics having higher rates of criminal victimization for robbery and aggravated assaults.
Whites had higher rates for the two categories of simple assault and rape/sexual assault.
Both Blacks and Hispanics were victimized at higher rates for violent crimes excluding simple assaults (what the Bureau of Justice Statistics refers to as “serious” violent crimes).
So while overall rates for violent victimization may be similar (first chart) they don’t tell the full story of the impact of violent victimization.
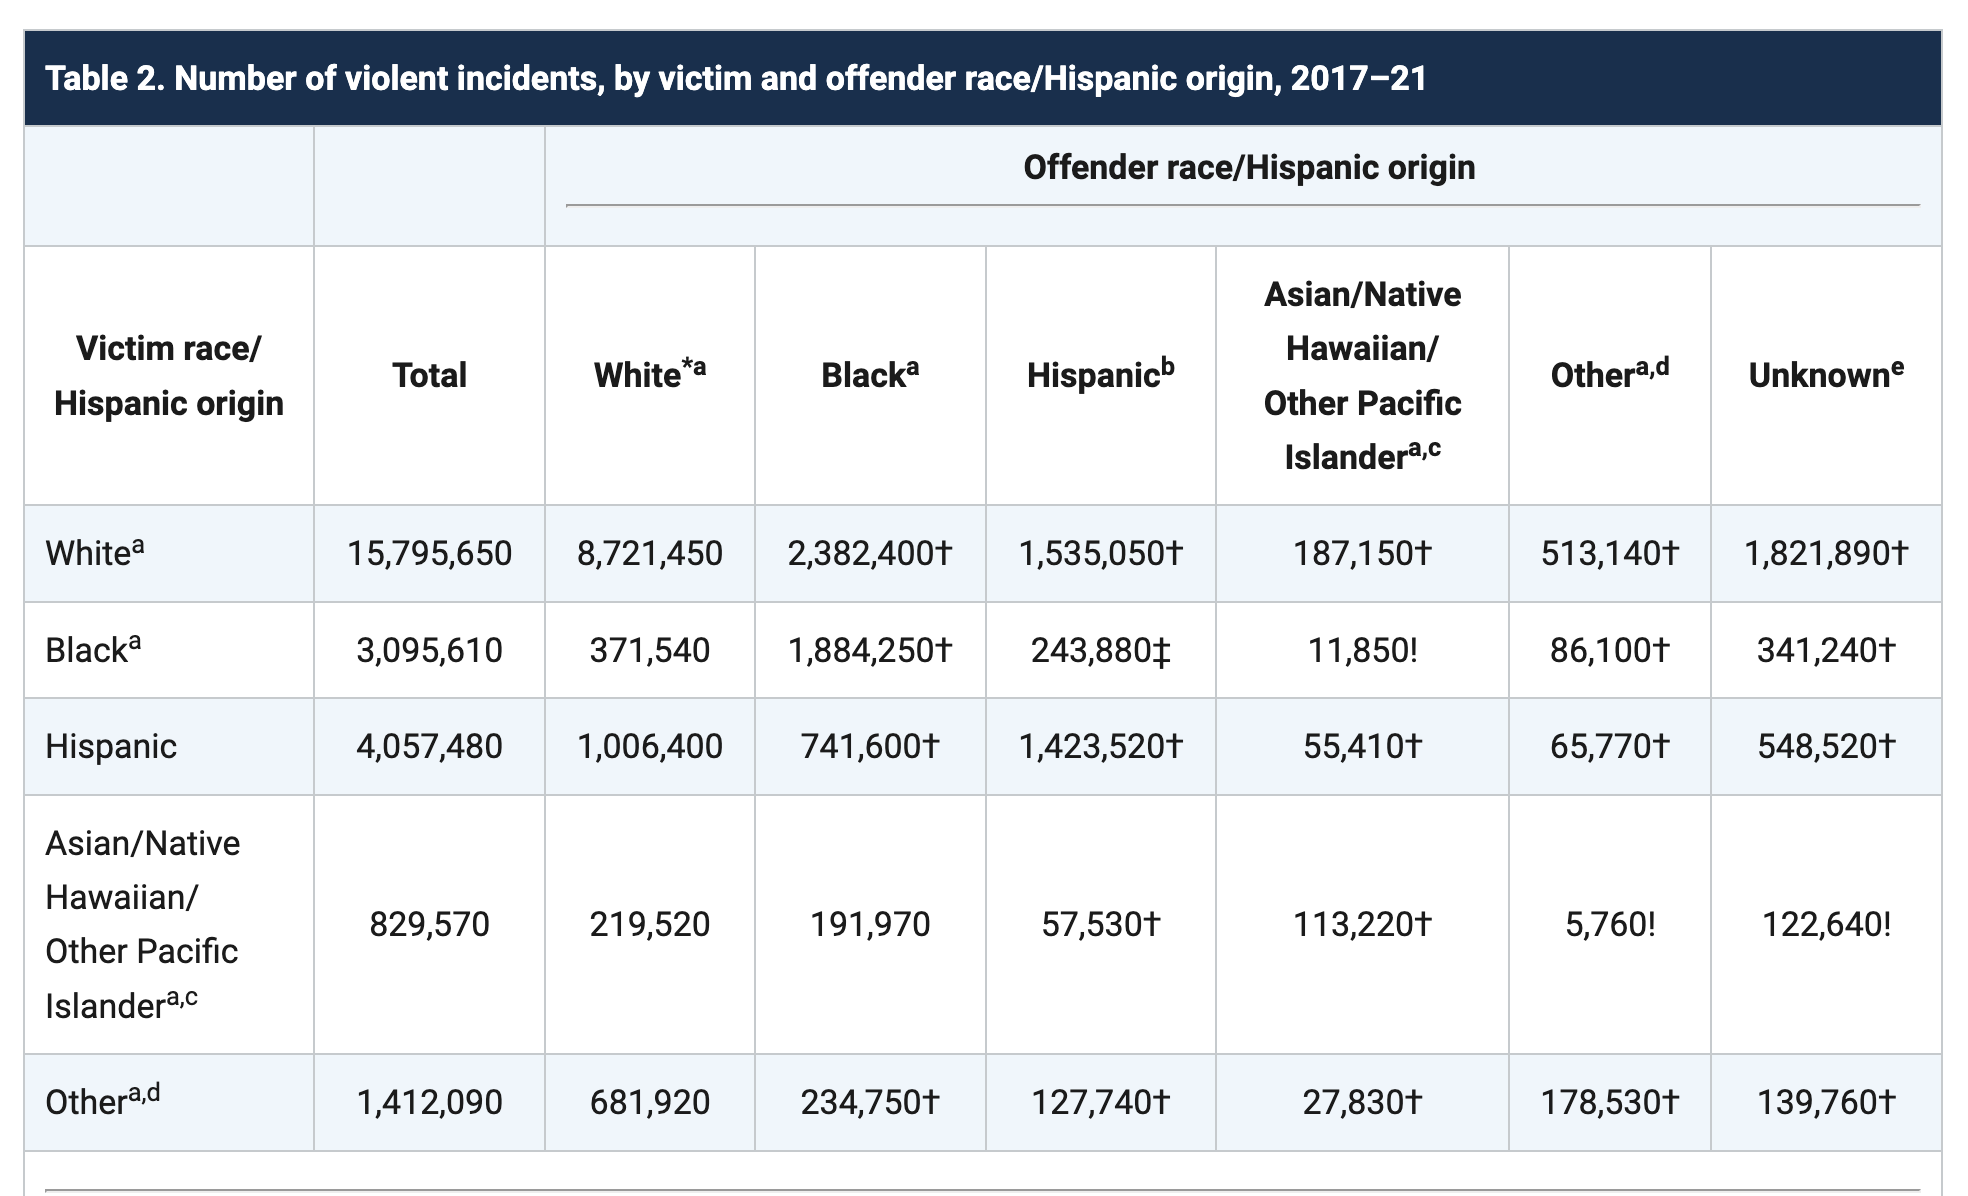
Criminal Victimization By Race Of Offender And Victim
The Bureau Of Justice Statistics has stated for years that the rates of violent victimization are mostly intra-racial which means that for the most part, groups victimize each other. Most violent incidents against white (69%) and black (66%) victims were committed by an offender of the same race or ethnicity as the victim.
The chart below contains numbers or incidents, not rates.
Non-Hispanic Whites constitute close to 60 percent of the US population while African Americans make up 13.6 percent and Hispanics 19 percent thus it’s inevitable that criminal victimization will be disproportionate based on the percentages offered by the US Census Bureau. The greater the number or percentage of potential victims, the higher their victimization numbers will be. For example, the White victimization of Hispanics may be influenced by the sheer number of White individuals in terms of statistical probability.
Conclusions
This site offers Who’s Impacted? Data On Victims Of Crime And Violence providing readers with an overview of the impact of violent crime on groups. Statistics alone do not tell the story adequately.
Per the Bureau of Justice Statistics and other research, who’s impacted depends on an endless number of variables like where you live (urban-suburban-rural-an apartment or single-family house), income, age, marriage status plus others.
An older married Black male living in an upper-class neighborhood will have a much lower statistical probability of becoming a victim of violent crime than a young White male living in an apartment in an economically challenged neighborhood.
Nevertheless, there is a variety of data suggesting that Black and Hispanic (Los Angeles) young males in low-income urban areas are bearing the brunt of the problem of serious violent crime
As with all statistics on violent crime victimization, attention to detail plus acknowledging other data provides the best base of knowledge of criminal victimization.
Privacy Policy
We do not collect your personal information. See our privacy policy at “About This Site.”
See More
See more articles on crime and justice at Crime in America.
Most Dangerous Cities/States/Countries at Most Dangerous Cities.
US Crime Rates at Nationwide Crime Rates.
National Offender Recidivism Rates at Offender Recidivism.
The Crime in America.Net RSS feed (https://crimeinamerica.net/?