

Highlights
This article delves into the use of firearms in violent crimes, presenting data from two key agencies within the US Department of Justice. The analysis is based on information obtained from the FBI’s crime reports and the National Crime Victimization Survey by the Bureau of Justice Statistics.
Author
Leonard Adam Sipes, Jr.
Retired federal senior spokesperson. Thirty-five years of directing award-winning public relations (and explaining crime data) for national and state criminal justice agencies. Interviewed multiple times by every national news outlet. Former Senior Specialist for Crime Prevention for the Department of Justice’s clearinghouse. Former Director of Information Services, National Crime Prevention Council. Former Adjunct Associate Professor of Criminology and Public affairs-University of Maryland, University College. Former advisor to presidential and gubernatorial campaigns. Former advisor to the “McGruff-Take a Bite Out of Crime” national media campaign. Certificate of Advanced Study-Johns Hopkins University. Former police officer. Aspiring drummer.
Author of ”Success With The Media: Everything You Need To Survive Reporters and Your Organization” available at Amazon and additional booksellers.
Please sign up for future articles on the front page of this website.
Quotes
All quotes are edited for brevity.
Data Used
What’s below is a mixture of charts and data from the FBI (crimes reported to law enforcement) and the National Crime Victimization Survey from the Bureau Of Justice statistics of the US Department of Justice plus related research
Even though this article is based on total crimes reported to law enforcement complied by the FBI in 2022 (latest data), violent crime rates and totals from the 2022 National Crime Victimization Survey are important for understanding the impact of violent crime on groups.
Background
This is the seventh in a series offering data from the FBI’s latest crime reports based on crimes reported to law enforcement. The first was Locations Of Violent Crime-Where Crime Happens. The second was The Time Of Day For Violent And Property Crimes. The third was Violent Crime Totals By State. The fourth was Violent Crime Victims By Race And Ethnicity-Who’s Victimized Most? The fifth was Are Females Violently Victimized More Than Males? The sixth was Most People Are Violently Victimized By Family Members Or People They Know.
Most Crimes Are Not Reported
Per the National Crime Victimization Survey from the Bureau of Justice Statistics of the US Department of Justice, only 42 percent of violent crimes are reported to law enforcement. Thirty-two percent of property crimes are reported. The USDOJ uses a national survey (National Crime Victimization Survey) as a gauge for all crimes.
In addition, there are major law enforcement agencies not reporting their crime data to the FBI’s National Incident-Based Reporting System for its 2022 report.
So what you read below from the FBI is a subset of total crime. Total crime is best represented by the National Crime Victimization Survey. See Violent And Property Crimes in The US for an explanation. Both collect and offer crime data differently.
Nevertheless, the numbers below from the FBI are some of the best indicators we have regarding the total number of “reported” crimes and the characteristics of crime.
Article
According to the latest report from the Bureau of Justice Statistics of the US Department of Justice based on the National Crime Victimization Survey, firearms are used in 10 percent of violent crimes.
About 10% of violent victimizations involved a firearm in 2022, up from 2021. Of the more than 6.6 million violent victimizations in 2022, about 10% involved a firearm, an increase from 7% in 2021. Firearm victimizations are violent victimizations where the offender possessed, showed, or used a firearm.
About 61% of firearm victimizations were reported to police in 2022, which was not significantly different from 2021.”
641,000 out of 4,598,000 violent crimes involved a firearm.
FBI Data
Note: I use rounded figures.
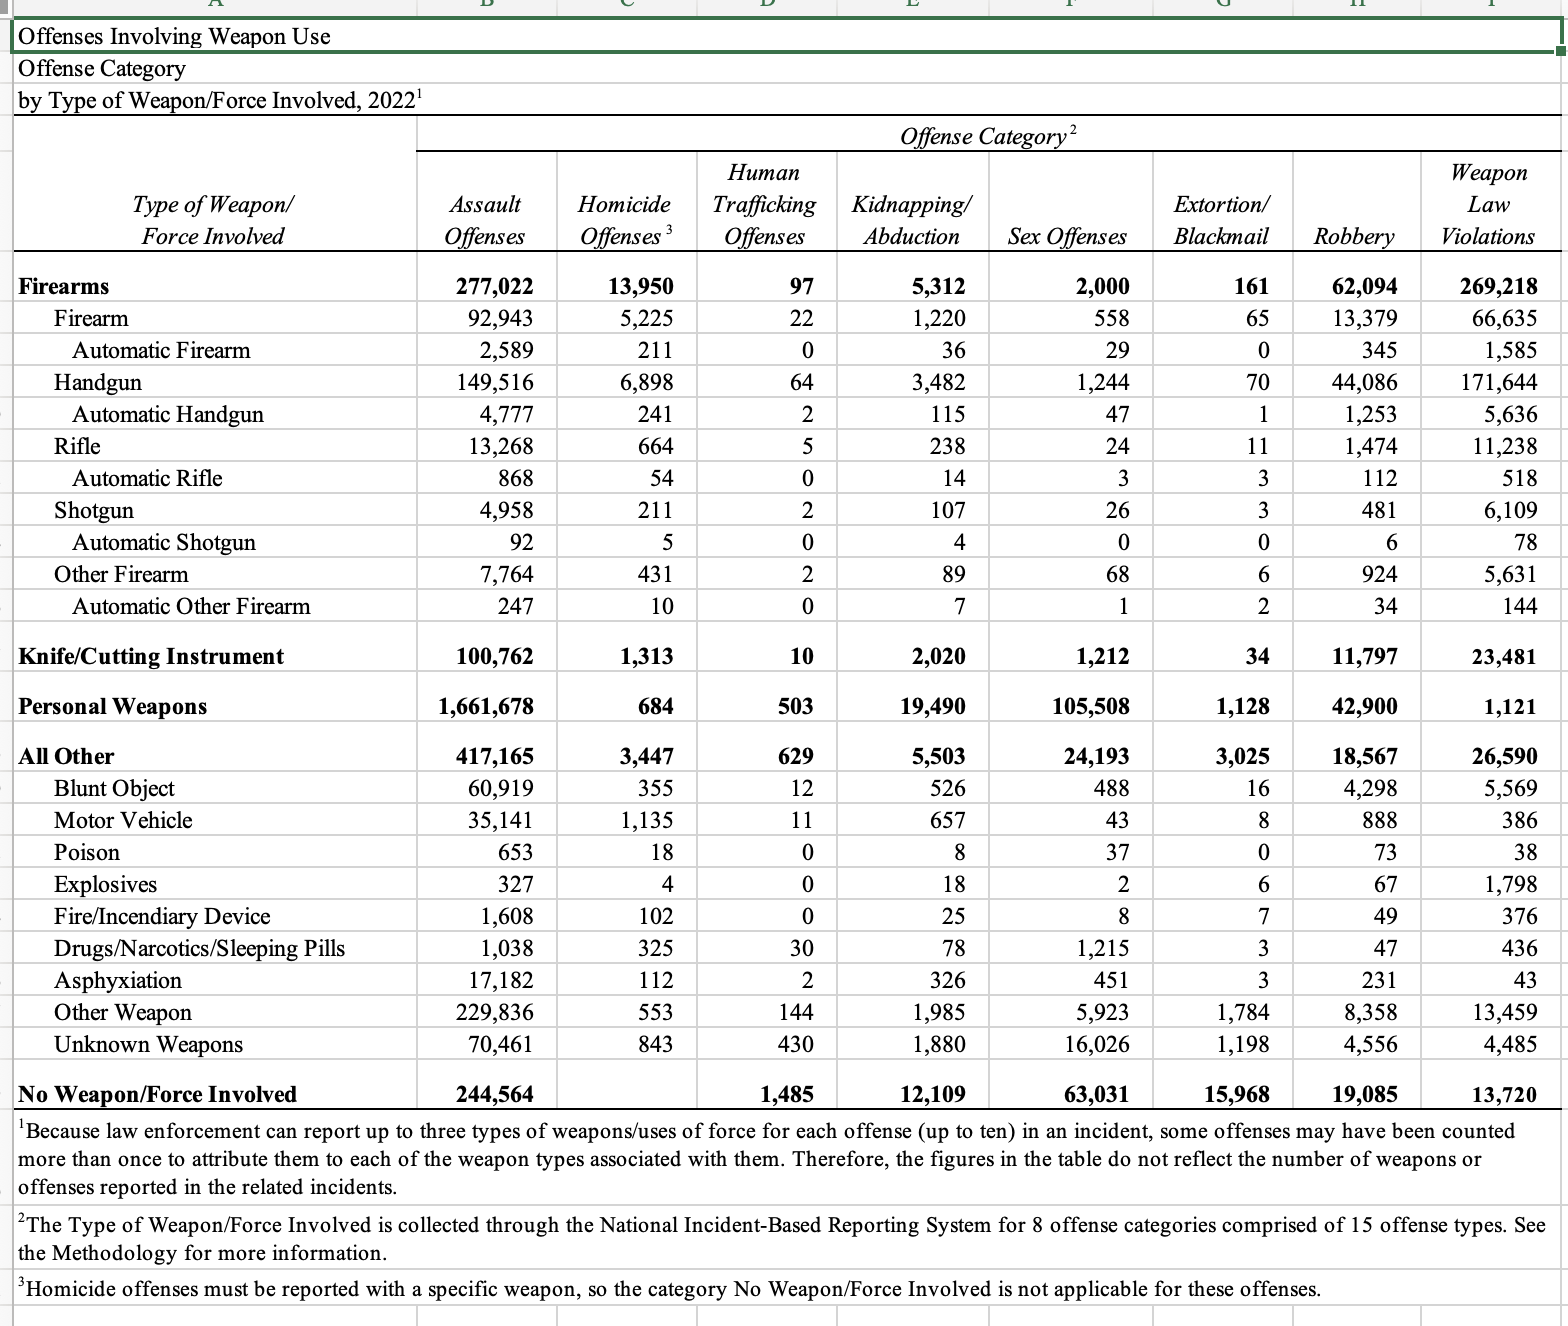
Note: The FBI defines personal weapons as the use of hands, fists, feet, etc.
In almost every category of crime listed in the FBI chart below, except homicides and weapons violations, knives, personal weapons, the “all other” category (i.e., blunt objects, motor vehicles) and no weapons used collectively exceeded firearms use during violent crimes.
By far, handguns were the most used firearm during violent crime. Rifles and shotguns were a small minority of firearms used.
For assaults, (the most common form of violent crimes) handguns were used 149,500 times. Blunt objects (i.e., a club) were used 61,000 times. No weapons used were counted 244,500 times. Knives were used 101,000 times.
There were more motor vehicles (35,000) used during assaults than rifles (13,000) and shotguns (5,000).
Firearms were the weapon of choice for homicides (14,000). All other weapons (i.e., motor vehicles-blunt objects) came in second at 3,500 and knives were third (1,300). Personal weapons were used 684 times.
The leading category for sex offenses was the personal weapons category (105,500) followed by the no weapons category (63,000). Firearms were used 2,000 times.
Robberies involved 62,000 firearms compared to 12,000 knives and 43,000 personal weapons. There were 18,500 “all other” weapons and 19,000 times where no weapon was used.
Conclusions
Based on data from the Bureau of Justice Statistics of the US Department of Justice, 10% of violent victimizations involved a firearm in 2022.
Those of us following data on violent crime data understand that firearm use is not connected with the great majority of violent criminal activity. When firearms were used, handguns constitute the clear majority.
That’s not to say that firearm use by the criminal population isn’t a huge problem, especially in urban areas. With 350-400 million firearms in the hands of private citizens, and now that Gallup has stated that private firearms are in 52 percent of American households, guns in the wrong hands will always be an issue, especially when considering suicides.
But to suggest that firearms propel the majority of violent crimes is simply incorrect. Knives, personal weapons, blunt objects, motor vehicles, and no weapons used collectively and considerably outweigh firearm use during violent crimes.
Privacy Policy
We do not collect your personal information. See our privacy policy at “About This Site.”
See More
See more articles on crime and justice at Crime in America.
Most Dangerous Cities/States/Countries at Most Dangerous Cities.
US Crime Rates at Nationwide Crime Rates.
National Offender Recidivism Rates at Offender Recidivism.
The Crime in America.Net RSS feed (https://crimeinamerica.net/?feed=rss2) provides subscribers with a means to stay informed about the latest news, publications, and other announcements from the site.