

Highlights
We offer the latest data from the FBI and the National Crime Victimization Survey as to how violent crime impacts groups based on race or ethnic heritage.
There are large increases in violence for groups per the National Crime Victimization Survey. As an example, for Hispanics, serious violent victimization increased from 5.4 per 1,000 to 11.0. There was also a big increase for Hispanics for all forms of violence in 2022. The unanswered question is why?
Race and ethnicity are factors of criminal victimization along with age, income, sex, and place. See the conclusion.
Author
Leonard Adam Sipes, Jr.
Retired federal senior spokesperson. Thirty-five years of directing award-winning public relations (and explaining crime data) for national and state criminal justice agencies. Interviewed multiple times by every national news outlet. Former Senior Specialist for Crime Prevention for the Department of Justice’s clearinghouse. Former Director of Information Services, National Crime Prevention Council. Former Adjunct Associate Professor of Criminology and Public affairs-University of Maryland, University College. Former advisor to presidential and gubernatorial campaigns. Former advisor to the “McGruff-Take a Bite Out of Crime” national media campaign. Certificate of Advanced Study-Johns Hopkins University. Former police officer. Aspiring drummer.
Author of ”Success With The Media: Everything You Need To Survive Reporters and Your Organization” available at Amazon and additional booksellers.
Quotes
All quotes are edited for brevity.
Notes
I’m the former senior specialist for crime prevention for the Department of Justice’s clearinghouse. I’m the former director of information services for the National Crime Prevention Council. I offer commentary from that experience and my six years in law enforcement. I have 35 years of explaining crime data while representing national and state justice agencies.
What’s below is a mixture of charts and data from the FBI (crimes reported to law enforcement) and the National Crime Victimization Survey from the Bureau Of Justice statistics of the US Department of Justice plus related research
Even though this article is based on total crimes reported to law enforcement complied by the FBI in 2022 (latest data), violent crime rates and totals from the 2022 National Crime Victimization Survey are important for understanding the impact of violent crime on groups.
I did not include notes for the charts presented. Readers are encouraged to go to the links provided and review the notes at the bottom of the charts. Notes can provide clarity as to the information provided.
Background
This is the fourth in a series offering data from the FBI’s latest crime reports based on crimes reported to law enforcement. The first was Locations Of Violent Crime-Where Crime Happens. The second was The Time Of Day For Violent And Property Crimes. The third was Violent Crime Totals By State.
Per the National Crime Victimization Survey from the Bureau of Justice Statistics of the US Department of Justice, only 42 percent of violent crimes are reported to law enforcement. Thirty-two percent of property crimes are reported. The USDOJ uses a national survey (National Crime Victimization Survey) as a gauge for all crimes.
In addition, there are major law enforcement agencies not reporting their crime data to the FBI’s National Incident-Based Reporting System for its 2022 report.
So what you read below from the FBI is a subset of total crime. Total crime is best represented by the National Crime Victimization Survey. See Violent And Property Crimes in The US for an explanation. Both collect and offer crime data differently.
Nevertheless, the numbers below from the FBI are some of the best indicators we have as to the total number of “reported” crimes and the characteristics of crime.
FBI Total Numbers (Not Rates) For Violent Victimizations
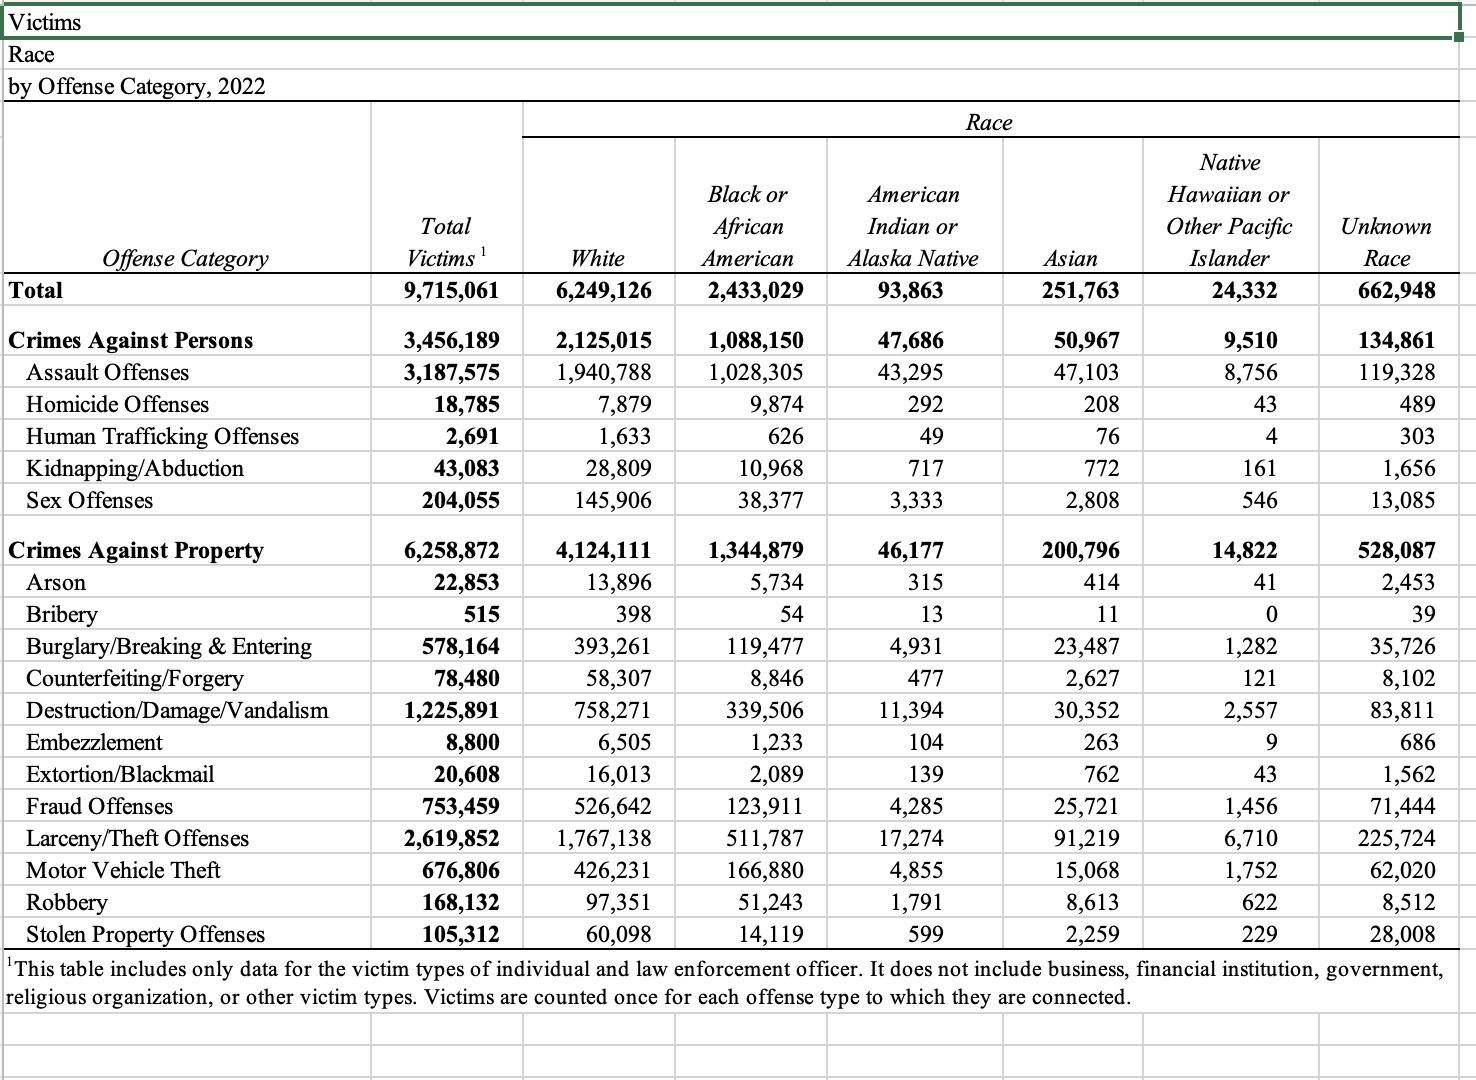
The following data from the FBI is based on crimes reported to law enforcement. For smaller categories, I use rounded numbers.
Whites were violently victimized 2,125,000 times, African Americans were victimized 1,088,000 times, Asians were victimized 51,000 times, American Indians were victimized 48,000 times, and Pacific Islanders were victimized 9,500 times. The unknown category includes 135,000 violent victimizations.
Per the FBI, Hispanics are captured under ethnicity and not race. A separate chart is offered for Hispanics below.
There are more homicides for African Americans (13.6 percent of the population-9,874) than for Whites (7,879). For all other violent and property crime categories, Whites exceeded all other groups.
I used violent crime data only for this analysis. The FBI considers robbery to be a property crime. Whites were the victims of robbery 97,351 times. African Americans were the victims of robbery 51,243 times.
Rates and totals from the National Crime Victimization Survey are offered below this chart.
Hispanics
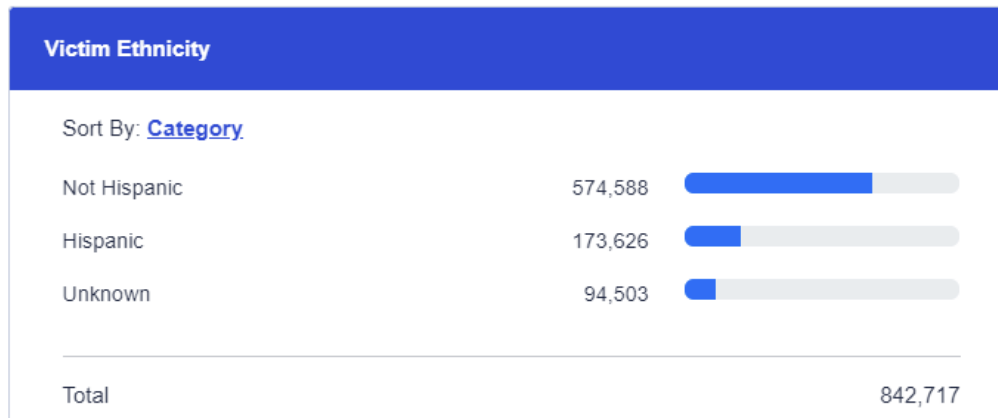
Per the FBI, for 2022, ethnicity was not published in the chart above. They did, however, offer the following table including totals for violent crime. Thus in terms of total numbers, the 843,000 crimes against persons for Hispanics puts Hispanics third behind Whites and African Americans. The unknowns are a significant number, 94,503.
Violent Rates From The National Crime Victimization Survey
What’s offered below are rates, total numbers are offered after the charts on rates.
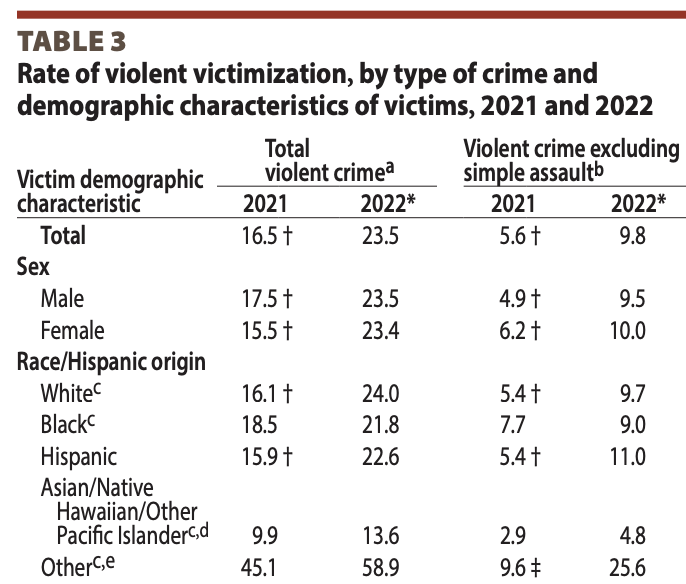
Overall violent victimization: For 2022, Whites (24.0) had the highest rates per 1,000 of violent criminal victimization followed by Hispanics (22.6), African Americans (21.8), and Asian-Pacific Islanders (13.6).
The “other” category (58.9) includes persons who identified as American Indian or Alaska Native only “or” as two or more races. Categories are not shown separately due to the small number of sample cases.
Mixed-race individuals have traditionally had the highest rates of violent victimization.
Serious Violent Crimes: In 2022, violent crimes excluding simple assaults (what the Bureau of Justice Statistics calls serious violent crimes) show that Hispanics (11.0) had the highest rate of victimization followed by Whites (9.7), and African Americans (9.0) were third. The lowest category includes Asian-Pacific Islanders (4.8).
The “other” category had, by far, the highest rate of serious violent victimization (25.6).
Note that the order for violent victimizations is different than 2021. There are huge increases in violent crime in 2022 (44 percent per Jeff Asher and The Marshall Project) and large increases in violence for groups per the National Crime Victimization Survey. As an example, for Hispanics, serious violent victimization increased from 5.4 per 1,000 to 11.0. There was also a big increase for Hispanics for all forms of violence in 2022. The unanswered question is why?
A 44 percent increase in violence would be the largest ever recorded. Yet, according to the FBI, violence decreased slightly in 2022.
Violent Total Numbers From The National Crime Victimization Survey
There are significant differences in totals of violent crime offered by the FBI via crimes reported to law enforcement versus totals offered by the National Crime Victimization Survey from the Bureau of Justice Statistics of the US Department of Justice. I use rounded numbers.
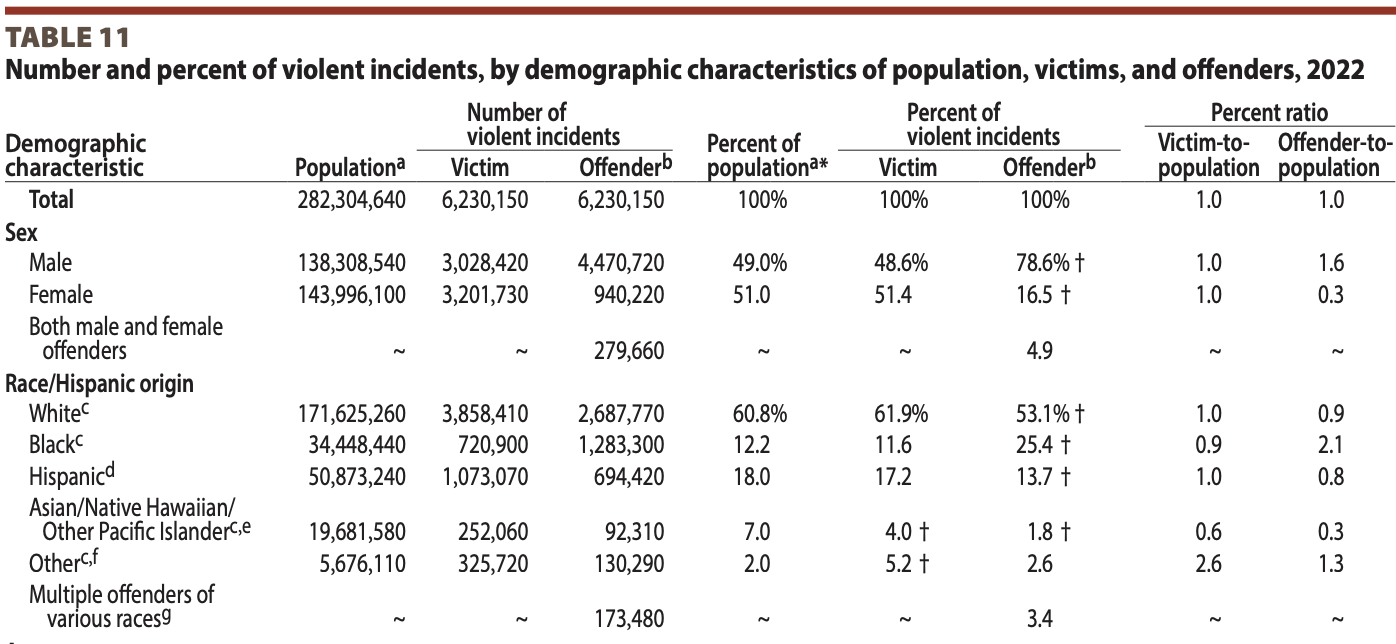
The National Crime Victimization Survey states that there were 6,230,000 violent crime incidents in 2022. Crime incidents are distinguished from victimizations in that one crime may have multiple victims.
The FBI offers 3,456,000 violent crimes in 2022, thus readers can see the numerical difference between reported (FBI) and total crimes via the National Crime Victimization Survey.
There were 3,858,000 violent incidents for Whites, 1,073,000 for Hispanics, 721,000 for African Americans, and 252,000 for Asian-Pacific Islanders.
Offenders
Per Criminal Victimization from the National Crime Victimization Survey:
In 2022, the proportion of violent incidents involving white offenders (53%), based on victims’ perceptions of the offenders, was lower than the share of white persons in the population (61%). The share of Asian offenders and Native Hawaiian or Other Pacific Islander offenders (2%) was less than the share of Asian persons and Native Hawaiian or Other Pacific Islander persons in the population (7%). The share of violent incidents involving Hispanic offenders (14%) was less than the population percentage of Hispanic persons (18%). The share of violent incidents involving black offenders (25%) was greater than the population percentage of black persons (12%).
There’s more on victims and offenders at Violent Criminal Victimization By Race Or Hispanic Origin.
Conclusions
Total numbers offered by the FBI and the National Crime Victimization Survey are interesting but somewhat challenging as a method of understanding violent criminal victimization by race or ethnicity. For that reason, I will use rates from the National Crime Victimization Survey.
Thus the best data we have for groups victimized is rates from the much larger numbers produced by the National Crime Victimization Survey.
As stated above, Whites (24.0) had higher rates per 1,000 for violent crimes in 2022, followed by Hispanics (22.6) and African Americans (21.8).
Excluding simple assaults, what the National Crime Victimization Survey calls “serious violent crimes,” Hispanics had higher rates per 1,000 (11.0) than Whites (9.7) and African Americans (9.0).
Asian-Pacific Islanders (4.8) had the lowest rates.
By far, the “other” category (25.6) had the highest rates, probably dominated by people of two or more races.
Do We Need To Consider Other Factors Beyond Race And Ethnicity To Understand Violent Victimization And Groups?
If one looks at Violent And Property Crime In The US, under the section titled, “Who’s Impacted By Crime? Data On Victims Of Crime And Violence,” there are additional factors to consider.
One example: “In certain U.S. cities, young men are over three times more likely to be shot dead than American soldiers deployed to war zones in the Middle East, new research reveals. The researchers looked at the demographics of the young men in the zip codes under investigation, they found that the risk of violent death and injury was almost entirely tied to individuals from minority racial and ethnic groups. Black and Hispanic males represented 96.2 percent of those who were fatally shot and 97.3 percent of those who experienced non-fatal gun injuries across all four cities.”
Thus race or ethnicity plays a part in understanding the impact of violence but when correlated with sex (males) or age (younger men) or location (cities or urban areas) or income levels (poverty), we gain a more complete understanding of groups and circumstances for violent criminal victimization when those factors are present.
Privacy Policy
We do not collect your personal information. See our privacy policy at “About This Site.”
See More
See more articles on crime and justice at Crime in America.
Most Dangerous Cities/States/Countries at Most Dangerous Cities.
US Crime Rates at Nationwide Crime Rates.
National Offender Recidivism Rates at Offender Recidivism.
The Crime in America.Net RSS feed (https://crimeinamerica.net/?feed=rss2) provides subscribers with a means to stay informed about the latest news, publications, and other announcements from the site.