

Highlights
We present the states with the highest and lowest totals of violent crime and provide some context based on numbers provided by the FBI based on crimes reported to law enforcement.
Author
Leonard Adam Sipes, Jr.
Retired federal senior spokesperson. Thirty-five years of directing award-winning public relations (and explaining crime data) for national and state criminal justice agencies. Interviewed multiple times by every national news outlet. Former Senior Specialist for Crime Prevention for the Department of Justice’s clearinghouse. Former Director of Information Services, National Crime Prevention Council. Former Adjunct Associate Professor of Criminology and Public affairs-University of Maryland, University College. Former advisor to presidential and gubernatorial campaigns. Former advisor to the “McGruff-Take a Bite Out of Crime” national media campaign. Certificate of Advanced Study-Johns Hopkins University. Former police officer. Aspiring drummer.
Author of ”Success With The Media: Everything You Need To Survive Reporters and Your Organization” available at Amazon and additional booksellers.
Quotes
All quotes are edited for brevity.
Note
I’m the former Senior Specialist for Crime Prevention for the Department of Justice’s clearinghouse. I’m the Former Director of Information Services, National Crime Prevention Council. I offer commentary from that experience along with my six years in law enforcement. I have 35 years of explaining crime data for national and state justice agencies.
Article
This is the third in a series offering data from the FBI’s latest 2022 crime reports based on crimes reported to law enforcement. The first was Locations Of Violent Crime-Where Crime Happens. The second was The Time Of Day For Violent And Property Crimes. The FBI is a US Department of Justice agency.
Per the National Crime Victimization Survey from the Bureau of Justice Statistics of the US Department of Justice, only 42 percent of violent crimes are reported to law enforcement. Thirty-two percent of property crimes are reported. The USDOJ uses a national survey (National Crime Victimization Survey) as a gauge of all crimes.
In addition, there are major law enforcement agencies not reporting their crime data to the FBI’s National Incident-Based Reporting System for its latest report.
So what you read in this article is a subset of total crime.
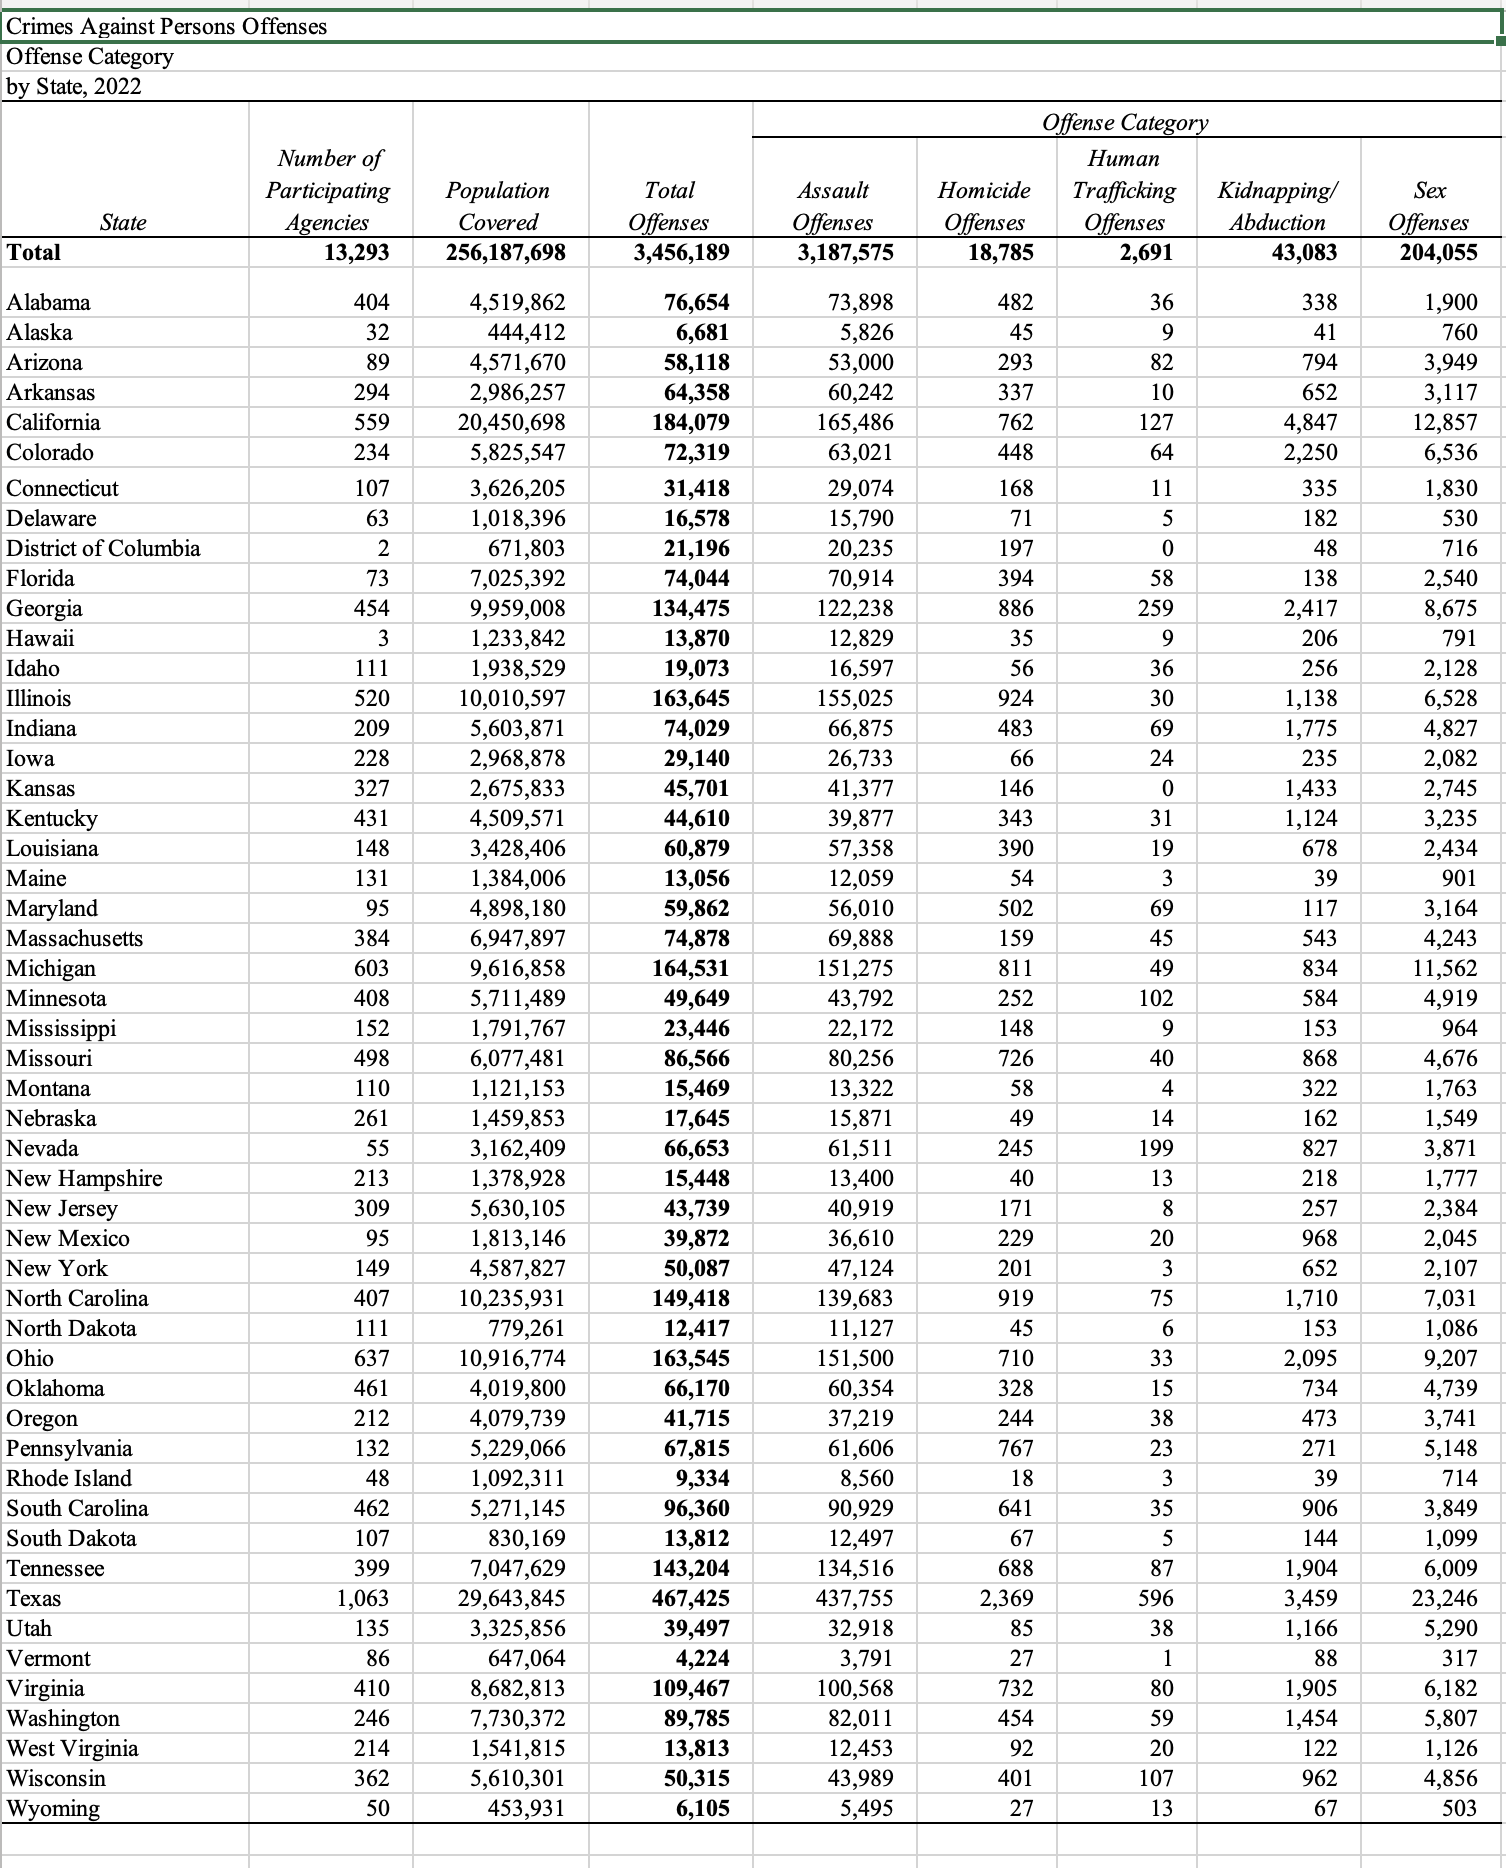
Nevertheless, the numbers below (see chart) are some of the best indicators we have as to the total numbers (not rates) of “reported” crimes and the characteristics of crime.
The Bureau of Justice Statistics of the US Department of Justice is experimenting with using National Crime Victimization Survey results at the subnational level including cities and metropolitan areas, but those results are not included in this article.
For the latest report from the Bureau Of Justice Statistics on crime in states, see States Having The Highest Rates Of Violent And Property Crimes.
Commercial Ranking Services
There are dozens of commercial publications offering their observations of the most dangerous states and cities, see City And State Crime Rates. Some include variables like income or areas of economic distress or other social factors, but the core of their findings is based on the FBI’s crimes reported to law enforcement.
What about cities? The list of cities is too large to offer here but you can find it on the FBI’s website via the latest quarterly report.
As with all other lists of “dangerous” states, readers understand that state figures can be influenced by city crime rates and totals. “Parts” of a state can have high rates of crime while the majority of its land mass can be safe.
Totals Vs. Rates
The chart below offers totals where the best method of rankings would be a reliance on rates. Alaska is one example where totals are low but rates (because of its small population) are routinely high when ranked by commercial publications. Totals for Rhode Island are small; it is the smallest state in terms of size.
But size can be deceiving, all the states listed in the lowest category have totals much less than the District of Columbia.
So can you depend on this or any other data to judge a dangerous or safe state? No. I’m writing this from Florida and the state is in the top ten for total violent crime “but” I live in a safe, well-policed community where stranger to stranger violent crime is almost nonexistent. It’s the same for all states. It often comes down to your community or the area you are considering moving to. Ask your local police as to where you should be concerned.
Ten States With The Lowest Total Violent Crime Numbers
The ten states are mostly rural or have a degree of isolation (i.e., Alaska and Hawaii). They include:
- Vermont
- Wyoming
- Alaska
- Rhode Island
- North Dakota
- West Virginia
- Hawaii
- Montana
- New Hampshire
- Nebraska
Ten States Based With The Highest Total Violent Crime Numbers
Huge states like California and Texas create larger numbers because of the size of their populations. The states with the largest numbers are mostly big with lots of cities. Most are southern states. They include:
- Texas
- California
- Michigan
- Illinois
- Ohio
- North Carolina
- Tennessee
- Georgia
- Virginia
- South Carolina
Privacy Policy
We do not collect your personal information. See our privacy policy at “About This Site.”
See More
See more articles on crime and justice at Crime in America.
Most Dangerous Cities/States/Countries at Most Dangerous Cities.
US Crime Rates at Nationwide Crime Rates.
National Offender Recidivism Rates at Offender Recidivism.
The Crime in America.Net RSS feed (https://crimeinamerica.net/?feed=rss2) provides subscribers with a means to stay informed about the latest news, publications, and other announcements from the site.