

Highlights
If you’re interested in yearly national “reported” crime data from the FBI, and how it’s produced, and what affects the numbers, this article is for you.
I just did an article about decreasing US crime in 2023 but police agency participation, the FBI’s new National Incident-Based Reporting System, and the underreporting of crime plus many other factors could impact final numbers.
It’s also important to understand the numbers offered by the USDOJ’s National Crime Victimization Survey and how it impacts our understanding of crime numbers and rates.
Author
Leonard Adam Sipes, Jr.
Thirty-five years of explaining crime data while directing multi-award-winning public relations for national and state criminal justice agencies.Retired federal senior spokesperson. Interviewed multiple times by every national news outlet.
Former Senior Specialist for Crime Prevention for the Department of Justice’s clearinghouse. Former Director of Information Services, National Crime Prevention Council. Former Adjunct Associate Professor of Criminology and Public Affairs-University of Maryland, University College.
Former advisor to presidential and gubernatorial campaigns. Former advisor to the “McGruff-Take a Bite Out of Crime” national media campaign. Certificate of Advanced Study-Johns Hopkins University. Former police officer.
Author of ”Success With The Media: Everything You Need To Survive Reporters and Your Organization” available at Amazon and additional booksellers.
Please sign up for future articles on the front page of this website.
Quotes
All quotes are edited for brevity.
Data Used
What’s below is data from the FBI (crimes reported to law enforcement).
Even though this article is based on crimes reported to law enforcement compiled by the FBI in 2022 (latest yearly data) and the first three quarters of 2023, violent crime rates and totals from the 2022 National Crime Victimization Survey are important for understanding the impact of violent crime on groups.
Background
This is the twelfth in a series offering data from the FBI’s latest crime reports based on crimes reported to law enforcement. The first was Locations Of Violent Crime-Where Crime Happens. The second was The Time Of Day For Violent And Property Crimes. The third was Violent Crime Totals By State. The fourth was Violent Crime Victims By Race And Ethnicity-Who’s Victimized Most? The fifth was Are Females Violently Victimized More Than Males? The sixth is Most People Are Violently Victimized By Family Members Or People They Know. The seventh is 10 Percent Of Violent Victimizations Involved A Firearm-Weapons Used During Crime. The eighth is Most Crimes Are Not Solved-Why? The ninth is 250,000 Attempted But Failed Property Crimes Per The FBI-Reasons Why. The tenth is What Causes Murders And Aggravated Assaults? The eleventh was Crime Victims By Age-Those 50 And Above Have Surprisingly High Numbers.
Most Crimes Are Not Reported
Per the National Crime Victimization Survey from the Bureau of Justice Statistics of the US Department of Justice, only 42 percent of violent crimes are reported to law enforcement.
Thirty-two percent of property crimes are reported. The great majority of what we call crime are property-related events which means that most crime is not recorded by the FBI.
Nevertheless, the numbers below from the FBI are some of the best indicators we have regarding the total number of “reported” crimes and the characteristics of those crimes.
The FBI’s New National Incident-Based Reporting System (NIBRS) Records More Crime Than The Previous Summary Reporting System
The FBI’s new National Incident-Based Reporting System is a vast improvement over the previous Summary Reporting System as to the quality of data it collects. But there are quirks.
From the International Association Of Chiefs Of Police (NACP) When a single offense type occurs during a crime incident, SRS and NIBRS will record identical crime counts.
Single-offense incidents account for about 88% of incidents recorded in NIBRS, meaning only about 12% of crime incidents will be affected by changes in reporting practices.
I’ve seen data suggesting that the National Incident-Based Reporting System “could” increase crime counts from 1 to 5.5 percent because it collects up to ten crimes instead of one per event.
This could be why it’s taken so long for some police agencies to switch to the new counting system; they fear increased crime numbers in their jurisdictions. Per the IACP, NIBRS captures up to 10 offenses per crime incident, allowing for offenses excluded under SRS reporting rules to be recorded.
I’m also confused by the finding that 88 percent of incidents in the NIBRs are single events. From my decades in the justice system as a police officer and my reviews of hundreds of individual criminal histories, I find that most arrests involve multiple crimes while understanding that most crimes do not end in an arrest.
Yet “reported” crime decreased for the first three quarters of 2023 per the FBI while more police agencies participated in the NIBRS thus collecting more crimes than before. Why?
Article
A common reader question is the number of law enforcement agencies in the United States and whether they offer their “reported” crimes to the FBI for national crime statistics. People are trying to understand the dynamics of crime reporting. If you’re interested in national crime data and how it’s produced, this article is for you.
How Officers Respond To Events Is A Judgment Call
As a teenager transporting paper products for a business serving food vendors in Baltimore’s Lexington Market (my first job) I witnessed a vicious fight involving weapons among four people. As I turned the corner, I saw a police cruiser with two officers and reported the event. They went to the scene of the aggravated assault and told the participants to stop. They did and walked away. No report was taken.
How officers respond to events is a judgment call based on the seriousness of the crime and whether it’s worth their time to engage in an investigation and extensive paperwork based on the probability of prosecution.
Events compromise crime reporting. Social media is filled with references from police officers that there are few consequences for many forms of criminality thus an arrest or a crime report is a waste of their time and takes away their ability to respond to serious events.
Crime Data From The FBI
Crime data from the FBI gets confusing due to the vast percentage of unreported crimes and many other factors.
Another issue is whether law enforcement agencies are reporting their data through the new (and vastly improved) National Incident-Based Reporting System (NIBRS).
The FBI created its National Incident-Based Information System (NIBIS) in 2015 replacing the antiquated Summary Reporting System (SRS). Please refer to the link for additional information but in short, the National Incident-Based Reporting System:
Provides greater specificity in reporting offenses. Not only does NIBRS look at all of the offenses within an incident, but it also looks at many more offenses than the traditional SRS does. NIBRS collects data for 52 offenses, plus 10 additional offenses for which only arrests are reported. SRS counts limited data for 10 offenses and 20 additional crimes for which only arrests are reported.
Collects more detailed information, including incident date and time, whether reported offenses were attempted or completed, expanded victim types, relationships of victims to offenders and offenses, demographic details, location data, property descriptions, drug types and quantities, the offender’s suspected use of drugs or alcohol, the involvement of gang activity, and whether a computer was used in the commission of the crime.
Helps give context to specific crime problems such as drug/narcotics and sex offenses, as well as issues like animal cruelty, identity theft, and computer hacking.
Provides greater analytic flexibility. Through NIBRS, data users can see many more facets of crime, as well as relationships and connections among these facets, than SRS provides.
As I understand it, 2021 national “reported” crime data was dependent on those using the National Incident-Based Reporting System, and national “reported” crime for 2022 (the most recent yearly national data as of this writing) was based on a combination of the NIBRS and the older Summary Reporting System.
The Problem
The problem with the National Incident-Based Information System is that it’s taken much longer than anyone anticipated to adapt to the new way of counting crime despite millions of federal dollars allocated for its implementation.
From Time Magazine: The following major cities did not report data to the FBI, or did not report data for the full year of 2021:
- Bakersfield, Calif.
- Baltimore
- Chicago
- Fresno, Calif.
- Jacksonville, Fla.
- Long Beach, Calif.
- Los Angeles
- Miami
- New York City
- Oakland, Calif.
- Omaha, Neb.
- Philadelphia
- Phoenix
- Sacramento, Calif.
- San Francisco
- San Jose, Calif.
- Tucson, Ariz.
- Washington, D.C.
Per The Marshall Project–Many Large Police Agencies Still Missing From National Crime Data For 2022.
Of the 19 biggest law enforcement agencies — each of which police more than 1 million people — seven were missing from the FBI’s 2022 crime data. The missing agencies include the LAPD, the NYPD, and police departments in Phoenix, San Jose and New York’s Suffolk County.
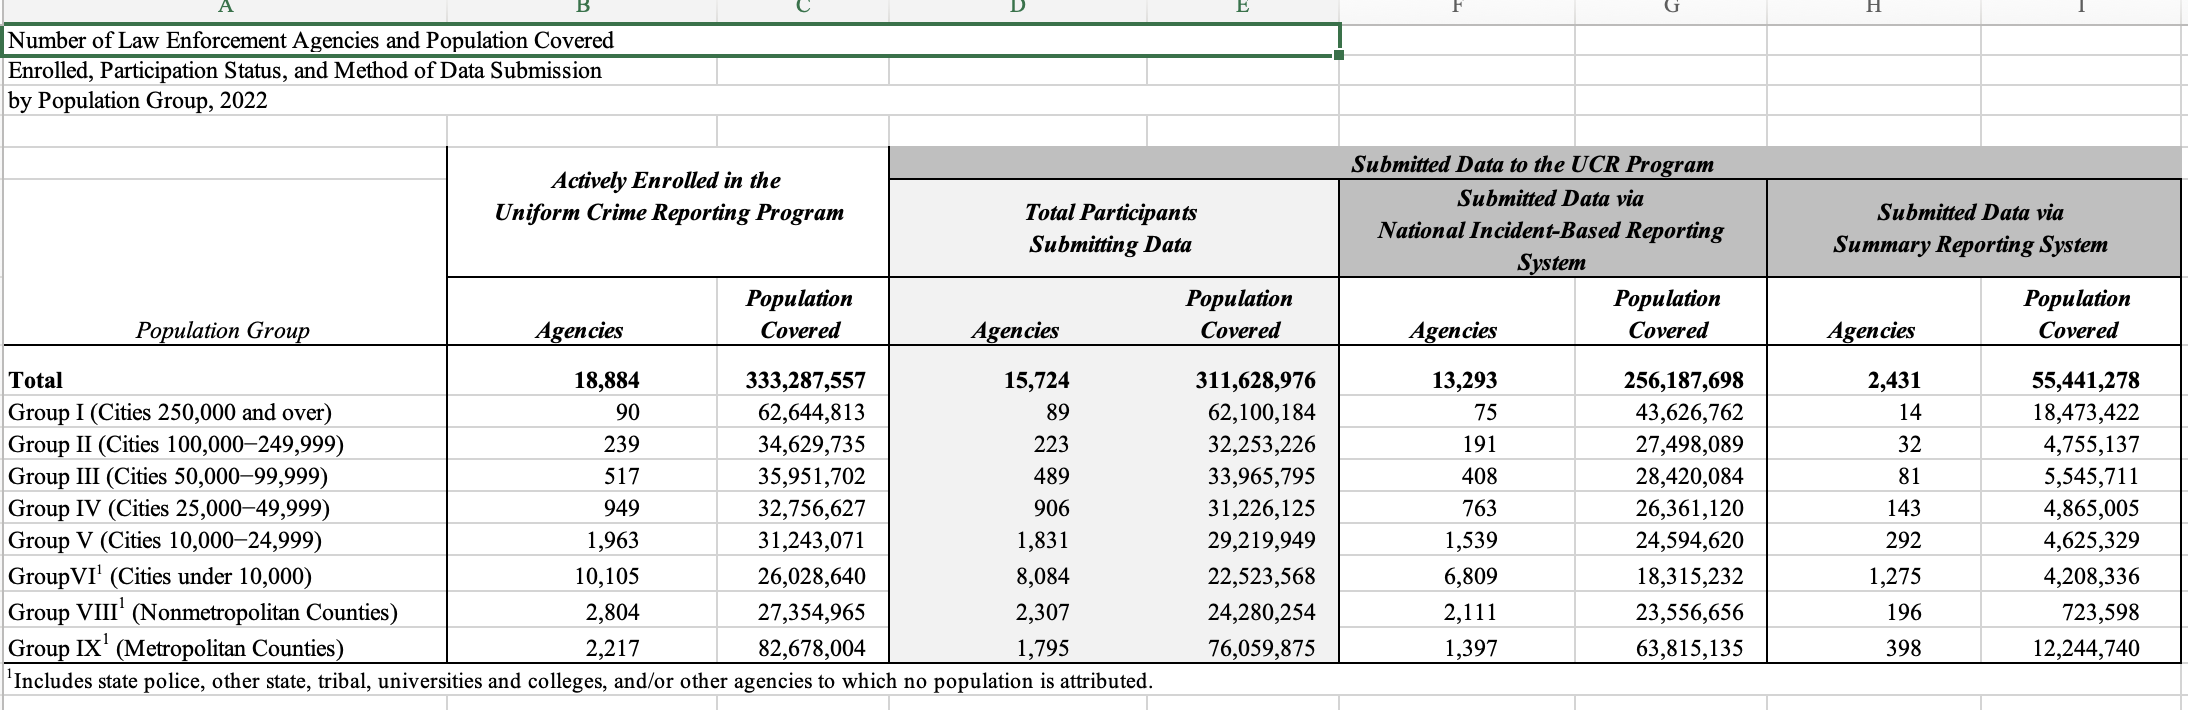
Number Of Law Enforcement Agencies Reporting Their Crime Data
The FBI states that there are 18,884 law enforcement agencies in the United States.
The great majority of law enforcement agencies are in cities under 10,000 in population.
2,804 are in nonmetropolitan counties and 2,217 are in metropolitan counties.
15,742 out of 18,884 submitted crime data in 2022.
13,293 submitted data via the National Incident-Based Reporting System in 2022.
2,431 submitted data via the old Summary Reporting System for 2022.
FBI Chart
Observations-Conclusions
The accurate reporting of crime in the United States is complex for multiple reasons. The National Crime Victimization Survey from the Bureau of Justice Statistics of the US Department of Justice offers a summation of total crime and the FBI offers crimes reported to law enforcement.
As stated, the vast majority of crime is not reported by citizens.
Reported crime decreased for the first three quarters of 2023. So we’re recording more crime through the NIBRS yet numbers decreased? How did that happen?
Crime rose considerably from 2019-2022 per the Major Cities Chiefs Association with a 50 percent increase in homicides and a 36 percent increase in aggravated assaults based on crime data from US and Canadian cities. Statistically speaking, it would be almost impossible for national crime to continue rising at that rate. It’s what researchers call a regression to the mean (or average). Throughout the history of counting crime, it goes up and down for reasons we find hard to articulate.
So even though we have more police agencies participating in the National Incident-Based Reporting System, and the NIBRS is collecting more crimes than previous systems, a reduction of “reported” crime was inevitable.
For the last yearly reporting of crime through the FBI in 2022, using rounded numbers, approximately 3,000 police agencies did not report their crimes and approximately 2,400 agencies used the old Summary Reporting System which counts fewer crimes.
Some of the 19,000 law enforcement agencies have a history of not counting all crimes due to political pressure to record smaller numbers.
Thousands of police officers have quit or retired thus making victims wait for long periods for an officer to arrive thus impeding crime reporting.
We also need to understand that the National Crime Victimization Survey from the US Department of Justice offered the largest yearly increase in violent crime in the nation’s history in 2022, 44 percent.
I’m not suggesting that the FBI’s count for the first three quarters of 2023 is incorrect. But some of the smaller decreases (aggravated assaults, property crimes, overall violent crime) fell in the 6 to 8 percent range meaning that a wide range of events could affect those numbers. Regardless, the decrease in most crime categories for 2023 is an improvement over the 2022 full-year FBI report where most categories of crime increased.
The bottom line is that we need to better understand the National Incident-Based Reporting System, the National Crime Victimization Survey, local practices, citizen crime reporting, and how they impact final crime counts.
Counting crime is far more complex than most realize.
Privacy Policy
We do not collect your personal information. See our privacy policy at “About This Site.”
See More
See more articles on crime and justice at Crime in America.
Most Dangerous Cities/States/Countries at Most Dangerous Cities.
US Crime Rates at Nationwide Crime Rates.
National Offender Recidivism Rates at Offender Recidivism.
The Crime in America.Net RSS feed (https://crimeinamerica.net/?feed=rss2) provides subscribers with a means to stay informed about the latest news, publications, and other announcements from the site.